Prometheus Monitoring Guide Part 1 - Installation and Instrumentation
05 Apr 2021An open-source systems monitoring and alerting toolkit. Now a standalone open source project and maintained independently of any company. Analyse how your applications and infrastructure is performing based on the metrics they publish. Particularly suitable for large distributed systems with ephemeral instances.
- metrics are stored in a
multi-dimensionaldata model instead ofhierarchical, where each measurement consists of a name and a number of key/value pairshttp.server.requests.count(uri="/endpoint", method="GET") 12instead ofhttp.server.requests.GET.endpoint=12- backed by it’s own custom time-series database built specifically for metrics
- provides it’s own query language
PromQLas a read-only and flexible query language for aggregation on time series data
- no reliance on distributed storage; single server nodes are autonomous
- time series collection happens via a pull model over HTTP
- targets are discovered via service discovery or static configuration
- multiple modes of graphing and dashboarding support
- Alternative to
Graphite,InfluxDB - Ecosystem provides a number of pre-built
exportersthat expose metrics ready for Prometheus to scrape
Architecture
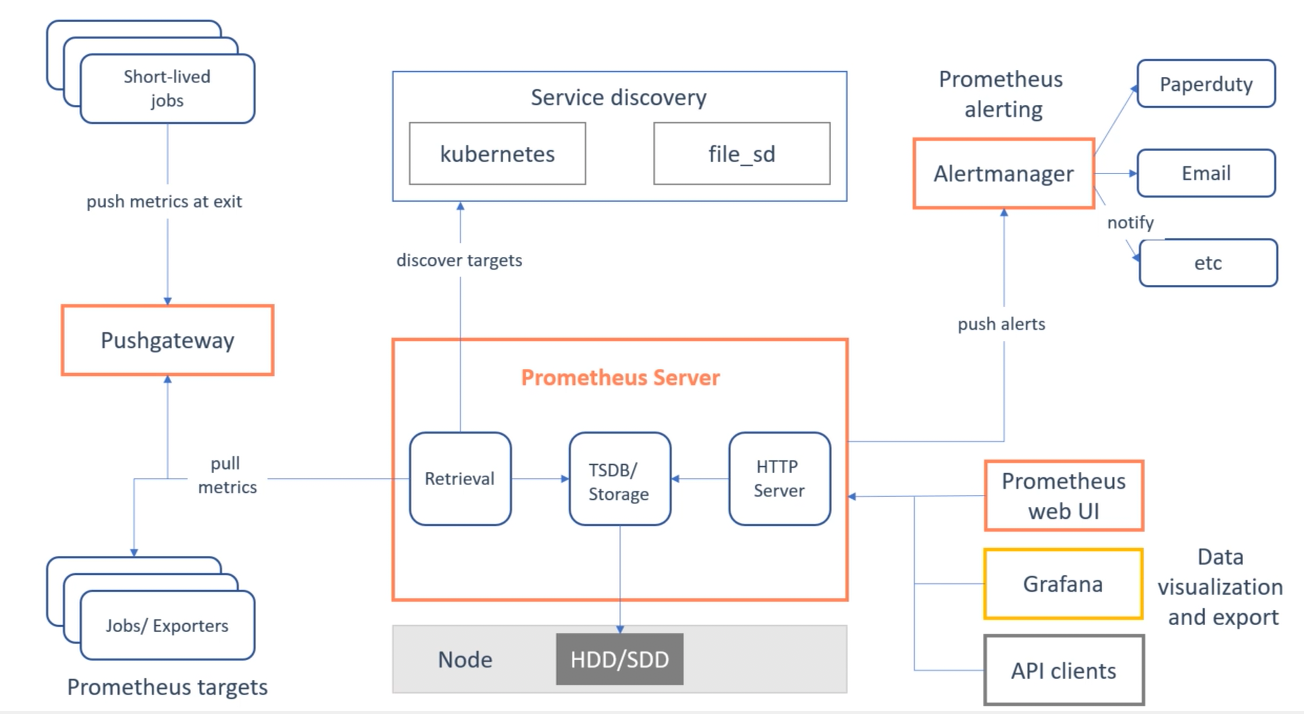
- main Prometheus server consists of a time series database storing each of the captured measurements
- alongside a scraper which pulls samples from external applications, hosts, platforms
- and an HTTP server which allows operations to be performed on the tsdb (e.g querying by PromQL)
- Prometheus is a single-instance component; all data is stored on local node storage
- if you need to scale, recommendation is to spin up multiple separate Prometheus instances with different/replicated targets
- operates in a
pullmodel, whereby Prometheus is setup to periodically scrape the metrics from all target application instances- therefore has to know about the location of all active instances via
service discovery - more easily tell if a target is down, can manually go to a target and inspect its health with a web browser
- application itself has no knowledge of Prometheus apart from an endpoint exposing the latest metrics snapshot (
/metrics)
- therefore has to know about the location of all active instances via
- the
pullmodel can be problematic for short-lived/batch operations which may not be alive long enough to be scrapedPushgatewaycomponent can be used as a middle-man - gets pushed metrics from jobs and forwards them to Prometheus
- service discovery integration into
Kubernetes,AWS,Azureto understand current landscape of all target nodes - after metrics are scraped and stored in tsdb, can be made available to users through web UI/Grafana/API
AlertManagercomponent can be used with a set of rules querying the metrics to generate system alerts- performs de-duplication of alerts, throttling, silences etc
- forwards to email,
PagerDuty,Slacketc
Installation
- provided as a single Go binary from https://prometheus.io/download/ so can be executed directly
./prometheus- by default looks for
prometheus.ymlconfig file in the same directory (by default will only scrape Prometheus itself)
- Prometheus Web UI available at
http://localhost:9090- allows you to view current targets, configuration and run queries. For more complex visualizations use
Grafana
- allows you to view current targets, configuration and run queries. For more complex visualizations use
- or can be executed through
Dockerdocker run -p 9090:9090 -v /path/to/prometheus.yml:/etc/prometheus/prometheus.yml prom/prometheus
Configuration
- all Prometheus config provided in
prometheus.ymlfile - Prometheus can reload its configuration at runtime. If the new configuration is not well-formed, the changes will not be applied
- reload is triggered by sending a
SIGHUPto the Prometheus process (kill -HUP <pid>) - or sending an
HTTP POSTrequest to the/-/reloadendpoint when the--web.enable-lifecycleflag is enabled
- reload is triggered by sending a
global: # applied to all targets unless overridden
    scrape_interval: 15s # how often to scrape each target
    evaluation_interval: 15s # how often to evaluate predefined rules

scrape_configs: # a set of jobs denoting where to scrape metrics from
    - job_name: "prometheus" # a group of targets, also added as a label to each measurement
      metrics_path: "/metrics" # default
      static_configs: # a hardcoded host/port or could be service discovery
          - targets: ["localhost:9090"] # uses metrics path to pull metrics, by default http
Service Discovery
static_configsdoes not scale to more dynamic environments where instances are added/removed frequently- Prometheus can integrate with service discovery mechanisms to automatically update it’s view of of running instances
- when new instances are added Prometheus will begin scraping, when lost from discovery the time series will also be removed
- built-in integrations with
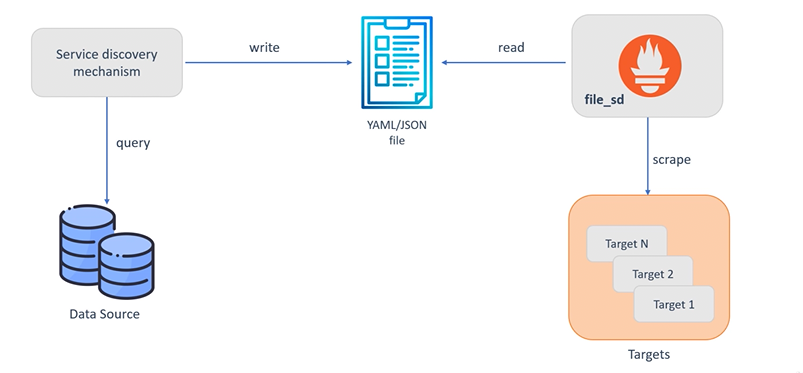
Consul,Azure,AWSor file based if custom mechanism required
JSON/YAMLfile can be published by the platform specifying all targets to scrape from. Prometheus uses it to automatically update targets
- job_name: 'myapp'
  file_sd_configs:
    refresh_interval: 5m # default
    - files:
      - file_sd.yml
Where the published file file_sd.json contains all the current live targets and any attached labels:
[
    {
        "targets": ["<host>"],
        "labels": {
            "<labelname>": "<labelvalue>"
        }
    }
]
Relabelling
Prometheus needs to know what to scrape, and that’s where service discovery and relabel_configs come in. Relabel configs allow you to select which targets you want scraped, and what the target labels will be. So if you want to say scrape this type of machine but not that one, use relabel_configs.
metric_relabel_configs by contrast are applied after the scrape has happened, but before the data is ingested by the storage system. So if there are some expensive metrics you want to drop, or labels coming from the scrape itself (e.g. from the /metrics page) that you want to manipulate that’s where metric_relabel_configs applies.
So as a simple rule of thumb: relabel_config happens before the scrape, metric_relabel_configs happens after the scrape
relabel_configs:
    - source_labels: [__meta_kubernetes_service_label_app]
      regex: nginx
      action: keep
    - source_labels: [__meta_kubernetes_endpoint_port_name]
      regex: web
      action: keep
    - source_labels: [__meta_ec2_public_ip] # rewrite private ip to public from service discovery
      regex: "(.*)"
      replacement: "${1}:9100"
      target_label: __address__
You can perform the following action operations:
keep: Keep a matched target or series, drop all othersdrop: Drop a matched target or series, keep all othersreplace: Replace or rename a matched label with a new one defined by thetarget_labelandreplacementparameterslabelkeep: Match theregexagainst all label names, drop all labels that don’t match (ignoressource_labelsand applies to all label names)labeldrop: Match theregexagainst all label names, drop all labels that match (ignoressource_labelsand applies to all label names)
metric_relabel_configs can be used to drop unnecessary time-series before ingestion:
- job_name: cadvisor
  metric_relabel_configs:
      - source_labels: [container_label_JenkinsId]
        regex: ".+"
        action: drop
      - source_labels: [__name__]
        regex: "(container_tasks_state|container_memory_failures_total)"
        action: drop
https://grafana.com/docs/grafana-cloud/billing-and-usage/prometheus/usage-reduction/
Instrumentation
- there are two ways in which application metrics can be exposed for Prometheus
- use a client library directly in the application to create and expose a Prometheus endpoint (usually
/metrics) - use an intermediate proxy
exporterinstance instrumenting the target application and converting to the Prometheus metrics format
- use a client library directly in the application to create and expose a Prometheus endpoint (usually
# HELP http_requests_total The total number of HTTP requests.
# TYPE http_requests_total counter
http_requests_total{method="post",code="200"} 1027 1395066363000
http_requests_total{method="post",code="400"}    3 1395066363000

# Minimalistic line:
metric_without_timestamp_and_labels 12.47

# A histogram, which has a pretty complex representation in the text format:
# HELP http_request_duration_seconds A histogram of the request duration.
# TYPE http_request_duration_seconds histogram
http_request_duration_seconds_bucket{le="0.05"} 24054
http_request_duration_seconds_bucket{le="0.1"} 33444
http_request_duration_seconds_bucket{le="0.2"} 100392
http_request_duration_seconds_bucket{le="0.5"} 129389
http_request_duration_seconds_bucket{le="1"} 133988
http_request_duration_seconds_bucket{le="+Inf"} 144320
http_request_duration_seconds_sum 53423
http_request_duration_seconds_count 144320

# Finally a summary, which has a complex representation, too:
# HELP rpc_duration_seconds A summary of the RPC duration in seconds.
# TYPE rpc_duration_seconds summary
rpc_duration_seconds{quantile="0.01"} 3102
rpc_duration_seconds{quantile="0.05"} 3272
rpc_duration_seconds{quantile="0.5"} 4773
rpc_duration_seconds{quantile="0.9"} 9001
rpc_duration_seconds{quantile="0.99"} 76656
rpc_duration_seconds_sum 1.7560473e+07
rpc_duration_seconds_count 2693
Conventions and Practices
- metrics names should start with a letter can be followed with any number of letters, numbers and underscores
- metrics must have unique names, client libraries should report an error if you try to register the same one twice
- should have a suffix describing the unit, in plural form (e.g
_bytesor_total) - should represent the same logical thing-being-measured across all label dimensions
- every unique combination of key-value label pairs represents a new time series, which can dramatically increase the amount of data stored. Do not use labels to store dimensions with high cardinality (many different label values), such as user IDs, email addresses, or other unbounded sets of values
Exporters
There are a number of libraries and servers which help in exporting existing metrics from third-party systems as Prometheus metrics. This is useful for cases where it is not feasible to instrument a given system with Prometheus metrics directly (Linux kernel) as cannot modify source etc
- https://prometheus.io/docs/instrumenting/exporters/
- an
exporteris a separate process dedicated entirely to pulling metrics from a target system and exposing them as Prometheus metrics- “proxy service” converting the target interface into one that can be scraped by Prometheus
-
Common exporters (some official):
- Node Exporter - hardware and OS metrics exposed by Unix kernels, CPU load, memory, I/O, network
- MySQL Expoter - database metrics, queries ran, timings, pool sizes
- Blackbox Exporter - probing of endpoints over HTTP, DNS, TCP, ICMP
- Kafka, Kafka Lag, Nginx, Postgres, Jenkins, AWS, Graphite, JMX
- for cases which you have access to modify the application code, instrumentation must be added in order to add Prometheus metrics
- can use existing application frameworks to expose default common metrics (
Spring Actuator) - use the client libraries to add custom metrics to be exposed (Go, Java, Python, Ruby)
- can use existing application frameworks to expose default common metrics (
- other metrics libraries offer a facade over the definition of metrics and allow pluggable Prometheus exporter to be added instead (
Micrometer)- don’t have to use Prometheus client library directly for increased flexibility in overall monitoring solution
Metric Types
The client libraries offer four core metric types. These are currently only differentiated in the client libraries (to enable APIs tailored to the usage of the specific types) and in the wire protocol. The Prometheus server does not yet make use of the type information and flattens all data into untyped time series.
Counter
- a cumulative metric that represents a single monotonically increasing counter whose value can only increase or be reset to zero on restart
- for example, you can use a counter to represent the number of requests served, tasks completed, or errors
- do not use a counter to expose a value that can decrease. For example, do not use a counter for the number of currently running processes; instead use a gauge
Gauge
- a metric that represents a single numerical value that can arbitrarily go up and down
- gauges are typically used for measured values like temperatures or current memory usage, but also “counts” that can go up and down, like the number of concurrent requests
Histogram
- samples observations (usually things like request durations or response sizes) and counts them in configurable buckets. It also provides a sum of all observed values
-
a histogram with a base metric name of
<basename>exposes multiple time series during a scrape:- cumulative counters for the observation buckets, exposed as
<basename>_bucket{le="<upper inclusive bound>"} - the total sum of all observed values, exposed as
<basename>_sum - the count of events that have been observed, exposed as
<basename>_count(identical to<basename>_bucket{le="+Inf"}above)
- cumulative counters for the observation buckets, exposed as
- use the
histogram_quantile()function to calculate quantiles from histograms or even aggregations of histograms across instances - when operating on buckets, remember that the histogram is cumulative
Summary
- similar to a histogram, a summary samples observations (usually things like request durations and response sizes). While it also provides a total count of observations and a sum of all observed values, it calculates configurable quantiles over a sliding time window
- a summary with a base metric name of
<basename>exposes multiple time series during a scrape:- streaming φ-quantiles (0 ≤ φ ≤ 1) of observed events, exposed as
<basename>{quantile="<φ>"} - the total sum of all observed values, exposed as
<basename>_sum - the count of events that have been observed, exposed as
<basename>_count
- streaming φ-quantiles (0 ≤ φ ≤ 1) of observed events, exposed as
- https://prometheus.io/docs/practices/histograms/
- if you need to aggregate, choose histograms.
- otherwise, choose a histogram if you have an idea of the range and distribution of values that will be observed. Choose a summary if you need an accurate quantile, no matter what the range and distribution of the values is.