
Prometheus Monitoring Guide Part 4 - Pushgateway and Blackbox Exporter
05 Feb 2022Pushgateway
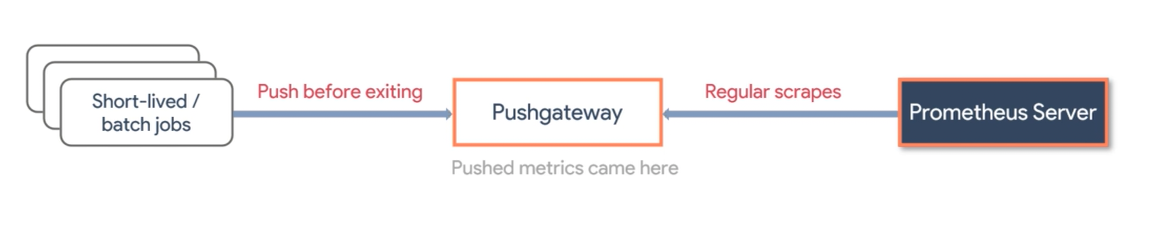
The pull approach doesn’t work for ephemeral jobs which don’t run for long enough for Prometheus to scrape them. Pushgateway is a metrics cache for service-level batch jobs. Used to handle the exposition of metrics that have ben pushed from batch/cron jobs. If a Pushgateway instance collecting metrics from many targets goes down, all metrics will be lost.
- provided as a single Go binary from https://prometheus.io/download/ so can be executed directly
./pushgateway- by default runs on port9091- or with Docker
docker run -d -p 9091:9091 prom/pushgateway
- need to add
Pushgatewayas scrape target in Prometheus
- job_name: "pushgateway"
  honor_labels: true # instrumentation labels to override target labels
  static_configs:
      - targets: ["localhost:9091"]
- metrics can sent from the job instance to
Pushgatewayby sending an HTTPPOSTrequestecho "some_metric 3.14" | curl --data-binary @- http://pushgateway.example.org:9091/metrics/job/some_job
- or Prometheus client libraries should have a feature to push the registered metrics to a
Pushgateway
Blackbox Exporter
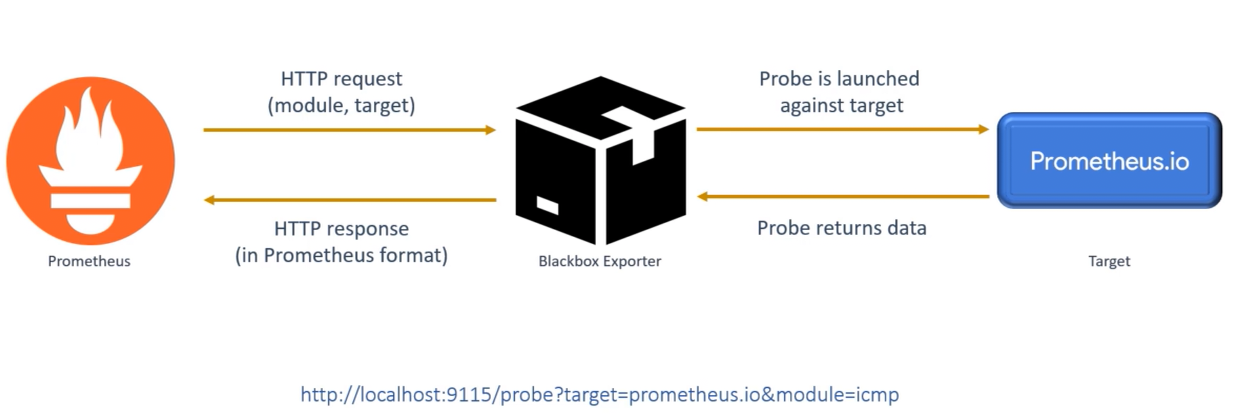
A probing exporter, allowing you to monitor network endpoints - upon probing it returns detailed metrics about the underlying requests.
- for use when you have no knowledge of system internals, to measure response times, DNS resolution timing, check availability of endpoints etc
- provided as a single Go binary from https://github.com/prometheus/blackbox_exporter so can be executed directly
./blackbox_exporter- by default runs on port9115- or with Docker
docker run --rm -d -p 9115:9115 -v pwd:/config prom/blackbox-exporter:master --config.file=/config/blackbox.yml
- to retrieve metrics in Prometheus, target the
probeendpoint directly (which performs and measures the request) - modules used to perform the network request (as defined in the probe URL) are defined in the
blackbox.ymlconfig file (HTTP, DNS, SSH)
Perform HTTP Request and Find Content in Response Body
# blackbox.yml
http_find_prom:
    prober: http
    http:
        preferred_ip_protocol: ip4 # by default ipv6
        fail_if_body_not_matches_regexp:
            - "monitoring"
http://localhost:9115/probe?target=prometheus.io&module=http_find_prom – probe_success = 1
Perform TCP Probe
http://localhost:9115/probe?target=localhost:8000&module=tcp_connect
Perform DNS Probe
dns_google:
    prober: dns
    dns:
        transport_protocol: "tcp"
        preferred_ip_protocol: ip4
        query_name: "www.google.com"
http://localhost:9115/probe?target=8.8.8.8&module=dns_google
Scraping to Prometheus
# prometheus.yml
scrape_configs:
    - job_name: "blackbox"
      metrics_path: /probe
      params:
          module: [http_2xx] # Look for a HTTP 200 response.
      static_configs:
          - targets:
                - http://prometheus.io # Target to probe with http
      relabel_configs:
          - source_labels: [__address__]
            target_label: __param_target # save current target address into temp param
          - source_labels: [__param_target]
            target_label: instance # move current address to instance label
          - target_label: __address__
            replacement: 127.0.0.1:9115 # redirect address