PHP - Stocks Portfolio Main Page
15 Oct 2013I have uploaded a website that I completed for coursework for a web development module. The website mimics a stocks portfolio of a user with an underlying database, and various pages to view, add, and query the stocks currently in the portfolio.
The main page offers a simple view of all the stocks currently in the portfolio. The values used do not currently update from any official source (as realtime stock pricing solutions can get extremely expensive). This page does a simple query of the underlying portfolio database, which holds the physical data about each stock, and displays them in a user friendly manner. The rows of the table are highlighted green or red depending on the price change of the stock (again this is not realtime, but was set explicitly when the stock was added). Here is a screenshot of my portfolio main page:
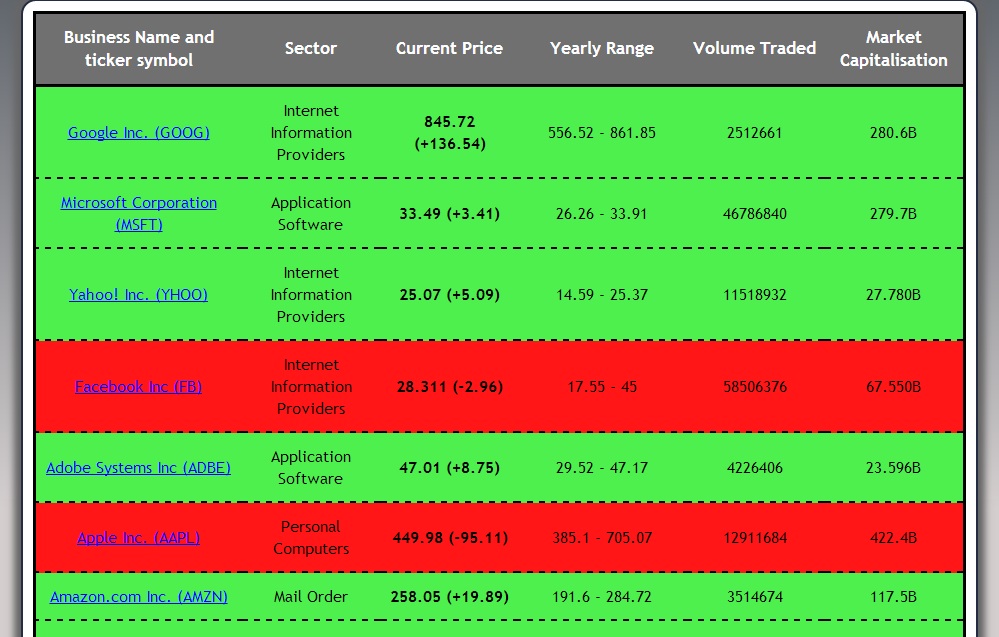
As you can see the main page displays all the relevant data about each stock in the portfolio, including the sector, price, yearly range, and the market capitalisation. The name of the stock on each row is also a link to the relevant page on Yahoo! Finance where a user can find even more detail about that particular stock.
The main page of the system displays all of the stocks currently in the portfolio, however does not give any kind of logical order (they are in fact always in the order that they were added). It would therefore be helpful to have some way of viewing the best and worst performing stocks in the current portfolio.This is the job of the top and worst stocks pages. Visually they are very similar to the main page of the system, however their queries to the database are modified to only include the best/worst stocks correspondingly, along with providing a more logical ordering.
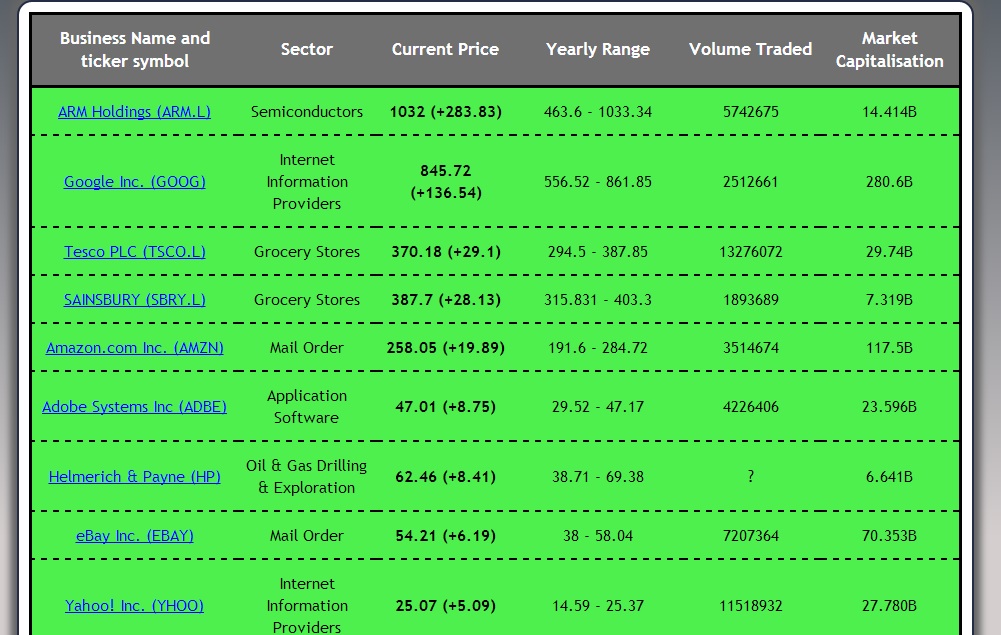
The top stocks page, which only displays the stocks in the portfolio whose price change is positive (i.e they are making money). As such they are all coloured green. The list if also ordered depending on how large the price change is. The stocks with the highest positive price change appear at the top of the table, and the lowest towards the bottom. Here is a screenshot from my portfolio:
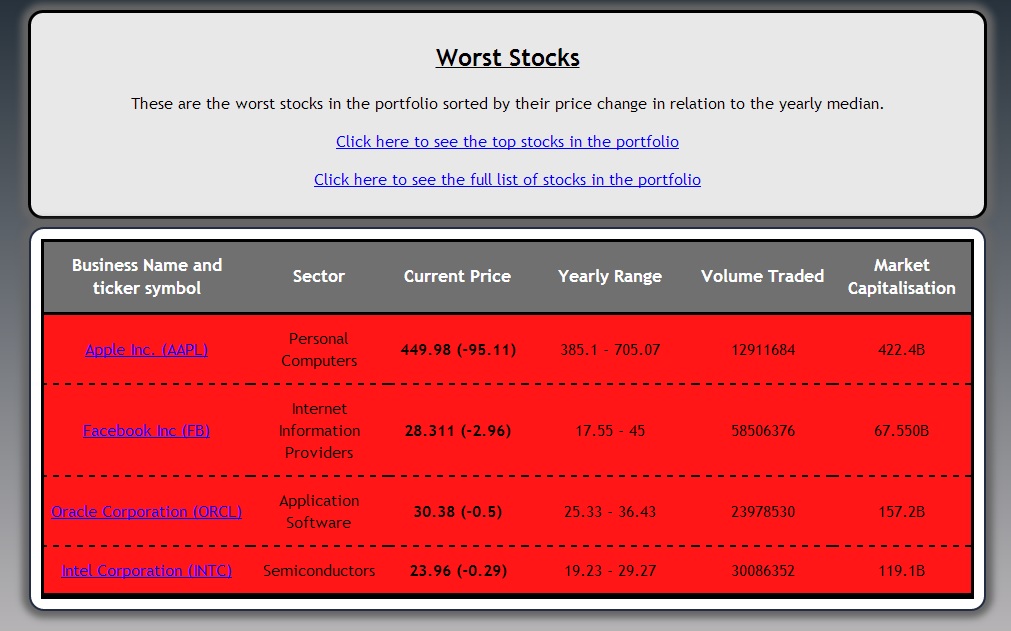
In comparison the worst stocks page only displays the stocks in the portfolio whose price change is negative (i.e they are losing money). As such they are all coloured red. The list if also ordered depending on how large the negative price change is. The stocks with the highest negative price change appear at the top of the table, and the lowest towards the bottom. Here is a screenshot from my portfolio:
The site also features a login system which allows users to add a new stock to the current portfolio. This is perhaps the best part of the system and includes some cool features to aid users.
You have to be logged in to the system to be able to add a new stock to the portfolio. This is a very helpful feature for future versions where multiple portfolios could co-exist, however at this moment the fact that users have to login to add new stocks to the portfolio simply prevents the unwanted hassle from a load of bots endlessly submitting the page and adding new rows to the underlying database (which would in itself ruin the rest of the site). Here is a screenshot of the login page which is what the redirect brings you to:
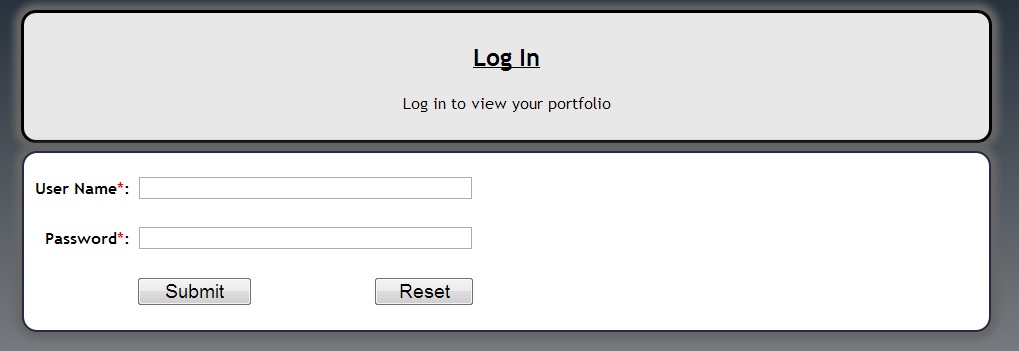
The login page is quite simple - just a username and password field. The system currently only has one registered user with a username of ‘admin’ and a password of ‘pass’. Entering in this two values and then pressing the ‘Submit’ button should successfully log you in to the system. The page now includes one link that takes you back to the main portfolio page.
The add new stocks page can be accessed from the link at the top of the main portfolio page. Now when following this link, you shouldn’t be redirected to the login page as you have already successfully logged in. Instead the ‘Add a new Stock to the Portfolio’ should load.
This page allows the user to enter information about a new stock they wish to add to the current portfolio. In doing so the stock will appear in the main page along with either the top or worst stocks pages where relevant.
The site uses a few Javascript functions to improve the overall usability. Such an example is a script that makes sure that all the compulsory fields are filled in with numeric data (where necessary), along with a script that automatically calculates the price change given a current price and yearly low/high. The formula used not exact by anyway means. It just calculates the difference between the current price and the yearly average:
change = price - ((yearlow + yearhigh) / 2)
The change is re-calculated every time any relevant field is updated to improve responsiveness.
However the best feature of this page is how the fields can be all automatically filled given a stock ticker from the user. For example starting with a blank form, type YHOO into the ticker field, and click on the ‘Find information from ticker’ button. A piece of Javascript then takes this ticker and downloads all the relevant information from Yahoo! Finance. This includes the current financial data and company information. When done, all the fields will now be filled out with the correct information:
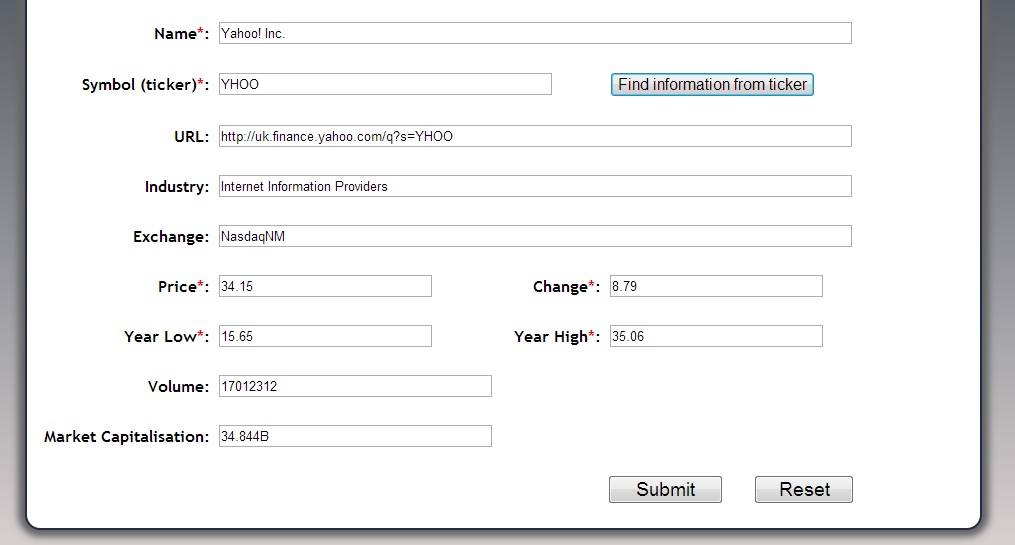
When all of the fields are filled in, the ‘Submit’ button can be pressed to add the new stock to the underlying portfolio database table. Doing so will then make the new stock appear in all other pages.