Distributed Tracing with Spring Boot & Jaeger
06 Aug 2021What is Distributed Tracing?
Tracing, alongside metrics and logs, form the three cornerstones of Observability, which aims to increase visibility and let anyone in the team navigate from effect to cause across a complex system. This differs from traditional ‘monitoring’ solutions based on passive consumption from static dashboards etc in that the underlying data should let you gain understanding actively and constantly ask questions about dynamic environments. The team should be able to understand what the system was doing at any particular point in time and identify potential scenarios that could lead to failure before it happens. This is even more important in modern distributed systems, whereby maintaining full visibility into each component and the transitions across component boundaries is vital, but increasingly more complex to manage.
Distributed tracing provides the insight into the flow and lifecycle of a request as it passes through a system. Modern day platforms may be split across many different isolated services, all of which may contribute to produce a final result. In a traditional monolithic style application this would be relatively straightforward to track as all the interactions to other systems would be housed in the same service, same logs etc. In a microservices style architecture a single client request could spawn a number of subsequent requests into various different areas components, which in turn may perform additional downstream requests. In addition, this might not be over the same protocol - HTTP via RESTful endpoints, perhaps various types of queues etc. As the logs for each of these components are separated, it can be extremely difficult and time consuming to track the series of events as it flows through different areas. It is also a very manual process - something that is unlikely to actively yield alerts for a potential point of failure in the future for example. Errors will typically be reported at the top-level, when in reality the issue may have been in a completely different space.
A Familiar Problem?
- you have a very distributed system, isolated into microservices, communicating over
HTTP - one request coming from the UI requires data from 2 other services to complete
- these 2 other services in turn also call out to other components (or out externally)
- the endpoint starts to fail, first action is to perhaps check the logs
- an exception is thrown during the
HTTPcall to the first service
- an exception is thrown during the
- now we need to start checking the logs for the second component
- second component/endpoint is busy - very difficult to correlate which logs lines correspond to the original erroneous request
- eventually find the correct area, again exception calling another downstream component repeat, repeat
Common distributed tracing solutions attach small pieces of metadata to the headers of each request, that are then propagated downstream to any subsequent services. Each individual component is then configured to send this metadata to a centralised tracing tool (Jaeger or Zipkin) which correlates the data and allows you to visualize the request as it passes through the system. Moving into other areas of the Observability space, these traces are also able to “glue” together the corresponding metrics and logging data - for any particular request/event you would be able to trace through the impact, but also see the logs and metrics from each of the downstream systems without having to manually search.
In summary, tracing aims to provide answers to questions such as:
- Which systems were involved in servicing a particular request?
- Which endpoints were called, what data was passed between them?
- Was there an error? If so where did it originate from?
- Root-cause-analysis
- What are the performance bottlenecks?
- Which endpoints are being called most often and may be best to prioritize for improvements/optimization
Landscape
Before we get into instrumenting our applications and viewing the tracing data, it’s worth understanding a bit of the background into some of the groups involved. This still seems to have many moving pieces and various projects trying to define the language/framework agnostic standards for distributed tracing (converging around OTEL). The aim here in general however is to come up with a generalized solution that avoids vendor locking and allows the traces to cross system boundaries (ensuring the metadata format is the same so any framework/tool can understand and propagate it forward).
OpenTracing
A CNCF project, now an incubating project – was/is a vendor-agnostic standardised API that allowed engineers to instrument traces throughout their code-base. It allowed for the creation of instrumentation libraries that would wrap around application code in order to record and report trace information. Can be thought of like SLF4J, acting as a facade over any implementation of the standard.
OpenCensus
Was a set of libraries that allowed you to collect application metrics and distributed traces in real-time. Similar to OpenTracing, it required the engineer to instrument the API calls into their code with the additional benefit of capturing metric data at the same time. The problem with the two options above is deciding which one to use. Should you use OpenTracing for tracing and OpenCensus for metrics? Or should they use OpenCensus for both tracing and metrics? This is where OpenTelemetry came in.
OpenTelemetry
OpenTelemetry (OTEL) was formed by the merging of OpenTracing and OpenCensus. Currently a CNCF sandbox project aimed to offer a single set of APIs and libraries that standardise how you collect and transfer telemetry data. OTEL not only aims to simplify the choice, but it also allows for cross-platform capability with SDKs being written in several different languages. Its architecture and SDKs allow for companies to develop their own instrumentation libraries and analyse the trace information with supported platforms. https://github.com/open-telemetry/opentelemetry-specification
Terminology
Span
Represents a single unit of work within the system. Spans can be nested within one another to model the decomposition of the work. A detailed explanation can be found on the OpenTracing site. For example, a span could be calling a REST endpoint and another child span could then be that endpoint calling another and so on in a different service.
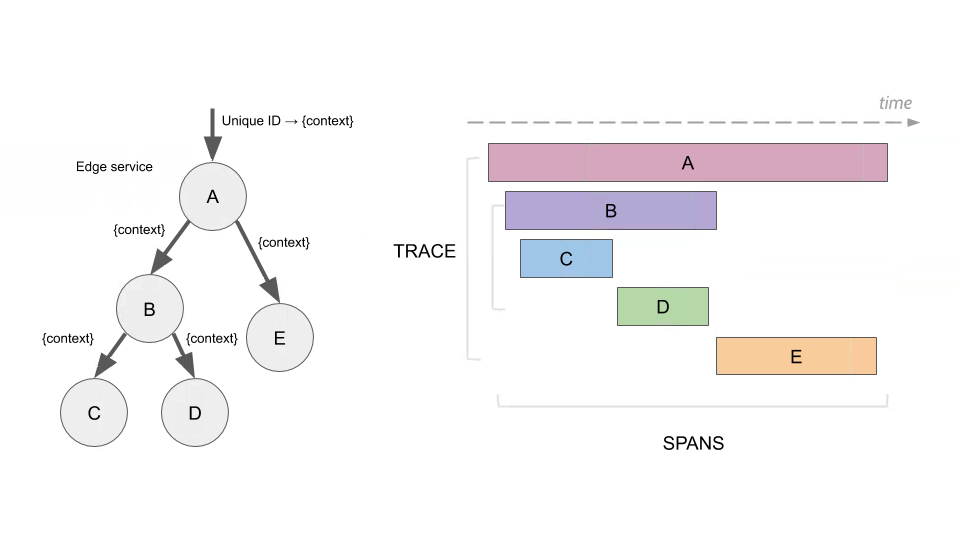
Trace
A collection of spans which all share the same root span, or more simply put all spans which were created as a direct result of the original request. The hierarchy of spans (each with the own parent span alongside the root span) can be used to form directed acyclic graphs showing the path of the request as it made its way through various components:
Trace Context
The bundle of metadata that is passed from one service to the other, allowing for the creation of the final hierarchical trace. Depending on the propagation type used this can take multiple forms, but usually includes at least the root and parent span id’s plus any extra “baggage”.
Context Propagation
The process of transferring trace information from one service to the other. Propagation is done by injecting the trace context into the message that is being sent. In the case of an HTTP call usually it is done by adding specific HTTP headers as defined by the standard. There are multiple different standards for this (which is where the complexity arises). Zipkin uses the B3 format whereas the W3C has also defined a new standard which may be preferable. The libraries being used should be able to support multiple types and convert between them.
Sampling
In larger systems, or for those which process a high number of requests, you may not want to record every trace. It could be unnecessarily expensive to do so or could put pressure on the collectors. Sampling aims to limit the total number of traces recorded whilst still preserving the underlying trends. For example, you might employ a simple rate limiting sampler or use more complex probabilistic or adaptive approaches.
Instrumentation
Injecting code into the service to gather tracing information. Can be done manually or automatically. As manual instrumentation requires some boiler plate code, the preferred way is to use auto instrumentation libraries from the providers.
Jaeger
Developed at Uber and now another CNCF graduated project, Jaeger is a distributed tracing platform that was inspired by Dapper and Zipkin. As the traces are generated by each service across the wider system (or even cross-platform), they can can then be sent to a centralised store such as Jaeger (or Zipkin). Once ingested, Jaeger provides the tools and UI to query and visualize the full traces, generate topology graphs, perform root cause analysis and monitor performance and latencies across components. In contrast to Zipkin, Jaeger has been designed from the ground up to support the OpenTracing standards so is likely to continue to increase in popularity over time.
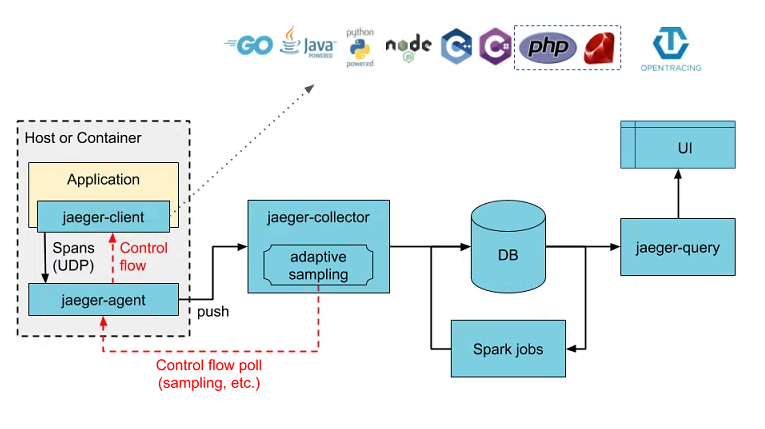
As shown in the above diagram, Jaeger itself is a large and complicated platform, consisting of a number of different components allowing it to scale to process potentially billions of spans per day. It does however offer an ‘all-in-one’ executable which packages the UI, collector, query and agent into one, but the spans are stored in memory so will be lost after restart. In a typical production deployment something like Elasticsearch would be used as the primary data store.
The easiest way to get started with Jaeger is to utilise the all-in-one offering which is an executable designed for quick local testing, launches the Jaeger UI, collector, query, and agent, with an in memory storage component. You can download the executable directly, or rather you can run through Docker with a single command:
$ docker run -d --name jaeger \
  -e COLLECTOR_ZIPKIN_HOST_PORT=:9411 \
  -p 5775:5775/udp \
  -p 6831:6831/udp \
  -p 6832:6832/udp \
  -p 5778:5778 \
  -p 16686:16686 \
  -p 14268:14268 \
  -p 14250:14250 \
  -p 9411:9411 \
  jaegertracing/all-in-one:1.25
Note how this command sets the Zipkin collector environment variable to inform Jaeger to accept Zipkin traces on port 9411 (will be configured in our app later on). For a full listing of the port mappings visit the Jaeger docs. But for a basic setup you only need 9411 (Zipkin) and 16686 (web). For a full production setup, each component would be deployed separately.
To verify that Jaeger is running successfully, navigate to http://localhost:16686 to view the UI. You should see the landing page:
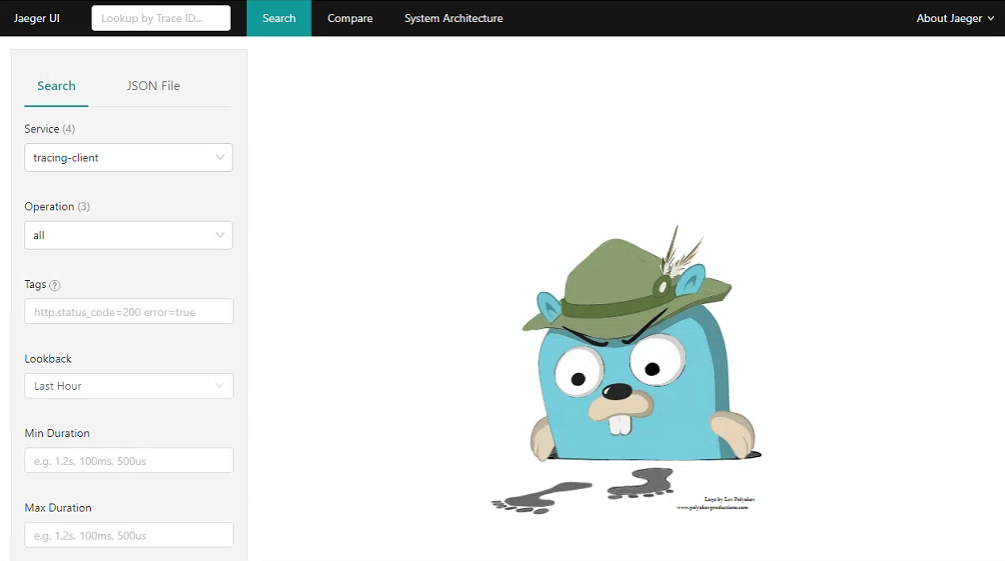
That’s all for now on the Jaeger setup. We can now start instrumenting our Spring applications to begin generating traces and forwarding them to our new Jaeger instance for visualization.
Sample Application
To start testing out the basics and get traces flowing into Jaeger, we’ll create a very simple application consisting of two services communicating over HTTP endpoints:
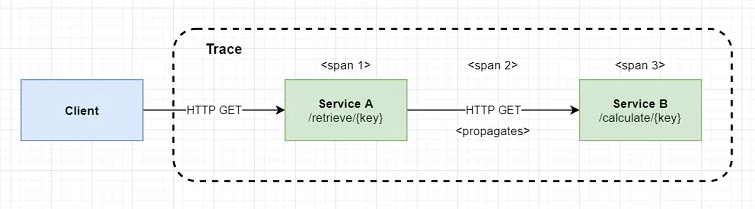
In a more real-world example this would be significantly more complex, but this basic setup should allow us to see the spans being created and propagated across our services:
- Client will call the /retrieve endpoint on the first service
- as this is the originator call a new trace context will be created with a root trace id and a single span
Service Aperforms anHTTPGETrequest toService Bto retrieve some data- another span is created within
Service Arepresenting the overall client call - the trace context is added to the
HTTPheaders of the outgoing request (propagation)
- another span is created within
Service Breceives the request- a final span id is created encompassing this new unit of work
Service Bsleeps for a random period of time representing some system latency
- Both requests complete and the final result is passed back to the Client
- the trace contexts held internally within
Service A/Bare sent asynchronously toJaeger
- the trace contexts held internally within
Spring Cloud Sleuth
Sleuth is a project managed and maintained by the Spring Cloud team aimed at integrating distributed tracing functionality within Spring Boot applications. It is bundled as a typical Spring Starter, so by just adding it as a dependency the auto-configuration handles all the integration and instrumenting across the app. You can just add the Jaeger/Zipkin client libraries and manually instrument yourself, but this requires larges amounts of boilerplate added to all endpoints, listeners to begin/end traces, propagate them etc. Out of the box Sleuth instruments:
- requests received at Spring
MVCcontrollers (RESTendpoints) - requests over messaging technologies like
KafkaorMQ - requests made with
RestTemplate,WebClient, etcSleuthwill add an interceptor to ensure that all the tracing information is passed in the requests. Each time a call is made, a newSpanis created. It gets closed upon receiving the response.
As you would expect, Sleuth also exposes properties and API’s to configure where the trace data is sent, additional baggage or tags, sampling and logging. The main downside of Sleuth is that it was built around Zipkin traces and so only supports forwarding them to Zipkin (Thrift via Brave) format for now. Luckily Jaeger also supports Zipkin traces, so we can still use Sleuth with Jaeger (but through a different collector). Until recently Sleuth only supported the Zipkin B3 propagation type, but now has support for the W3C format which is preferable moving forward. By adding the brave-opentracing library, Sleuth will also automatically register an OpenTracing Tracer bean allowing us to use the standardised interfaces (much like SLF4J).
Note: Moving forward compatibility with the now GA OpenTelemetry standard (OTEL) is desirable. Sleuth does not currently integrate this as it’s extremely new, but as with most standards, the Spring team are actively working on it (https://github.com/spring-cloud-incubator/spring-cloud-sleuth-otel ). Also, previously one limitation of Sleuth was that it only supported the single tracer implementation (Brave). This has also now been rectified making Sleuth a much more viable solution longer-term (https://github.com/spring-cloud/spring-cloud-sleuth/issues/1497):
“Thanks to doing this abstraction we are able to support new tracer implementations, not only Brave. We’ve decided to add support for the OpenTelemetry SDK as the second one. If in the future if we decide to add new tracers then it will be just a matter of adding a new module that bridges to the Spring Cloud Sleuth one (https://github.com/spring-cloud/spring-cloud-sleuth/commit/6e306e594d20361483fd19739e0f5f8e82354bf5)”
To add Spring Cloud Sleuth to the services, we need the following Gradle config:
ext {
    set('springCloudVersion', "2020.0.3")
}

dependencies {
    implementation 'io.opentracing.brave:brave-opentracing'
    implementation 'org.springframework.cloud:spring-cloud-starter-sleuth'
    implementation 'org.springframework.cloud:spring-cloud-sleuth-zipkin'
}

dependencyManagement {
    imports {
        mavenBom "org.springframework.cloud:spring-cloud-dependencies:${springCloudVersion}"
    }
}
This adds the Spring Cloud BOM to our project and imports both the core Sleuth starter and the sleuth-zipkin starter which allows the app to generate and report Zipkin compatible traces via HTTP (even though we will be sending them to Jaeger in this case).
We also need to set the following in application.properties:
server.port=8001
spring.application.name=service-a
spring.sleuth.propagation.type=B3,W3C
spring.sleuth.opentracing.enabled=true
spring.zipkin.base-url=http://localhost:9411
- The Spring application name is what will be shown in
Jaegeras theservice name - We enable both
B3andW3Cpropagation contexts for maximum compatible across platforms OpenTracingis enabled (due to having thebrave-opentracing) dependency allowing us to use theio.opentracing.Tracerinterfaces etc- We set the
ZipkinURL- this points to theZipkincollector on ourJaegerinstance as set by the config in the previous section
Next we can create two very simple endpoints in both Service A and B:
@RestController
public class CalculateController {

    private static final Logger log = LoggerFactory.getLogger(CalculateController.class);

    @Autowired
    private Tracer tracer;

    @GetMapping(value = "/calculate/{key}", produces = MediaType.TEXT_PLAIN_VALUE)
    public String calculate(@RequestHeader Map<String, String> headers, @PathVariable("key") String key) throws InterruptedException {
        log.info("Inside /calculate/{key} with key={}", key);
        log.info("Active Span: " + tracer.activeSpan().context().toSpanId());
        headers.forEach((k, v) -> log.info("Request Header '{}' = {}", k, v));
        long sleep = (long) (Math.random() * 5000L);
        log.info("Sleeping for {}ms", sleep);
        Thread.sleep(sleep);
        log.info("Returning result={}", sleep);
        return Long.toString(sleep);
    }
}
The above shows the endpoint for Service B mimicking a long running calculation:
- Able to inject the
io.opentracing.Tracerinstance to access the current trace context - Print the Request headers showing us the context propagation headers
A similar endpoint is also added to Service A which just uses a RestTemplate to call Service B. We can now perform a quick test by starting with services locally and visiting http://localhost:8001/retrieve/second. In the logs for Service B we see some interesting lines:
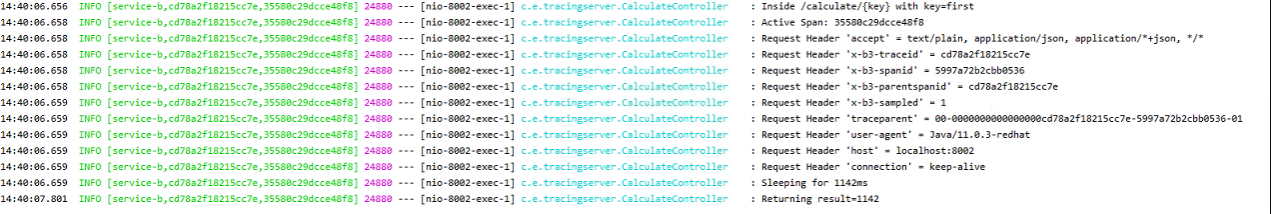
- By default
Sleuthadds the trace and span ids to theSLF4J MDCmeaning that they can be logged alongside the usual output. This is really useful to perform trace/log correlation, as once you have the root trace id you can useSplunkto directly locate the same request across any downstream services - In the headers of the
HTTPrequest fromService Awe can see the trace context propagation in action- In both
B3andW3C(traceparent) format the trace id and parent span ids are passed with the request Sleuthwill capture these id’s and automatically add them to any subsequent requests
- In both
- We can
autowireand use theio.opentracing.Tracerinstance to print the current active span
Visualizing in Jaeger
As the Spans are closed at each interval as the request passes from service to service, Sleuth will asynchronously send the trace context to the collector. We can then use a tool such as Jaeger to aggregate and visualize the full trace. Note that Sleuth defaults to a rate limited sampler that means that it will sample up to 1000 transactions per second. Visit the Jaeger dashboard again from above, in the Service dropdown you should see the two new entries for service-a and service-b. Perform a search to see the trace information (click to expand):
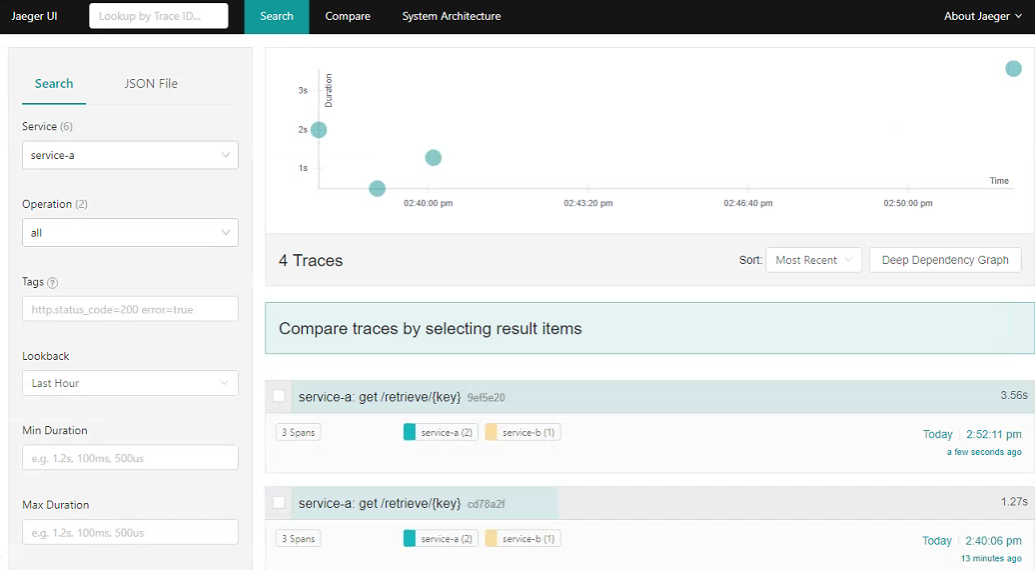
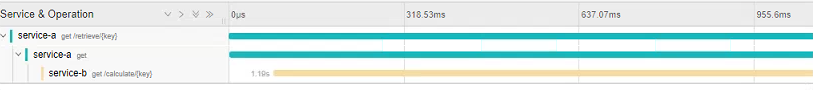
Here we can see all the root traces originated from our call to the /retrieve endpoint. Clicking on an individual item allows you to drill-down into the spans (click to expand):
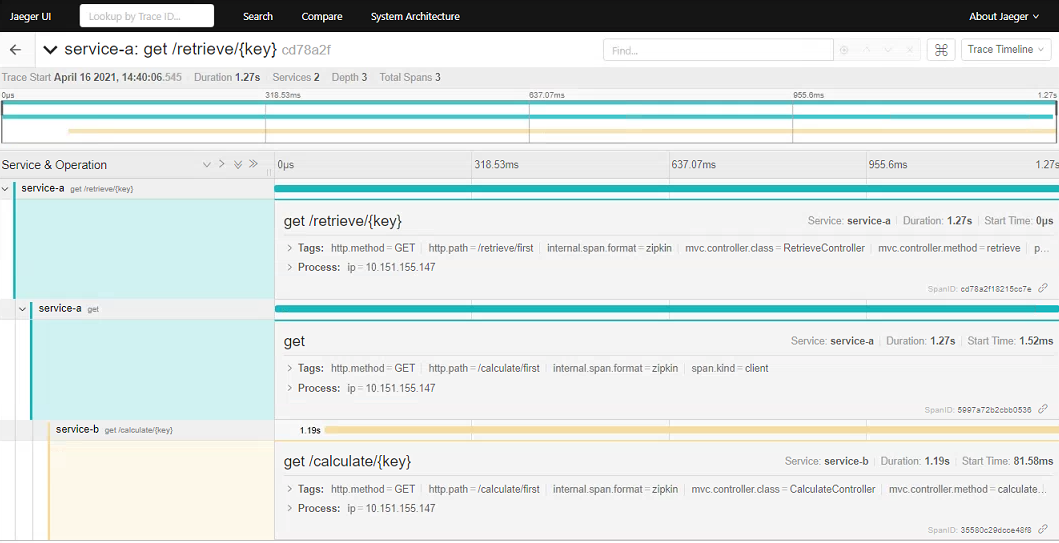
This clearly shows how the initial root GET request to the /retrieve endpoint in Service A spawned a request to the /calculate endpoint in Service B. We can also inspect the timings of each stage - in this case clearly seeing that call to Service B contributes to the bulk of the processing time (which is expected due to the sleep we added).
Each span also displays a number of Tags. By default Sleuth includes some helpful information such as the controller name, method and the full request url. We can use the OpenTracing API to add additional tags to the trace as required. Finally, we can also use Jaeger to construct a graph of the request flow. In our case this is very simple, but this would be extremely useful to generate topologies in larger systems. Below, the Service B span is marked as red since it was a slow running call that took up 94% of the total request times (click to expand).

Further Steps
This just scratches the surface of distributed tracing with Sleuth and Jaeger. Some points of further investigation:
- Deciding if Spring
Sleuthis the best approach. Investigate use of theOpenTracingJaeger Spring starter instead? Might be more standards compliant but less integrated in the Spring ecosystem? - Keep track of progress in
OpenTelemetryand the associated integration for Spring apps (ongoing) - Test the instrumentation and tracing of Kafka and JMS
- Understand productionizing Jaeger - security, data storage etc