Remote Debugging Java Apps with IntelliJ
19 Jan 2026A junior developer recently came to me for help with one of those classic issues which appears on a remote dev environment, but for whatever reason can’t (at least easily) be replicated locally. Their immediate thought was to add more log statements and redeploy the app to see what’s going on. Not unreasonable, but this is a dev environment, so I connected IntelliJ to one of the running containers and began stepping through the code and inspecting variables. They looked at me thinking I was performing some kind of black magic, so here’s an intro or a quick reminder of something which goes very underappreciated.
Why Remote Debug?
There are a few general scenarios when you might reach for remote debugging:
- Environment-specific bugs - Issues that only appear in staging, testing, or production-like environments with specific configurations, data, or network conditions
- Container debugging - When your application runs inside Docker containers or Kubernetes pods and you need to debug without rebuilding images
- Shared development environments - Debugging applications running on shared development servers or VMs
- Integration testing - Troubleshooting complex integration scenarios with external systems that can’t be replicated locally
Rather than relying solely on log statements or trying to recreate production conditions locally, remote debugging lets you step through the actual running code in the target environment - a lot better than adding log statements!
How It Works
Java remote debugging uses the Java Debug Wire Protocol (JDWP), which is a communication protocol between a debugger and a Java
Virtual Machine. The JVM opens a socket that a debugger can connect to, allowing it to control execution, set breakpoints, inspect
variables, and evaluate expressions.
The JVM can act as either a server (listening for debugger connections) or a client (connecting to a debugger). In most cases, you’ll configure the JVM as a server and then have your IDE connect to it.
Enabling Remote Debugging
To enable remote debugging, you need to pass specific JVM arguments when starting your Java application. The modern syntax (Java 9+) looks like this:
java -agentlib:jdwp=transport=dt_socket,server=y,suspend=n,address=*:5005 -jar myapp.jar
Here’s a high-level breakdown of what each parameter does:
-agentlib:jdwp- Loads the JDWP agent library for debuggingtransport=dt_socket- Uses socket transport for the debug connection (the standard approach)server=y- Configures the JVM to listen for debugger connections rather than connecting out to a debuggersuspend=n- Starts the application immediately without waiting for a debugger to attach. Usesuspend=yif you need to debug startup codeaddress=*:5005- Binds to all network interfaces on port 5005. You can specify a specific IP address or hostname instead of*
For older Java versions (Java 8 and earlier, so I hope you won’t see this), you might see the older syntax:
java -Xdebug -Xrunjdwp:transport=dt_socket,server=y,suspend=n,address=5005 -jar myapp.jar
This accomplishes the same thing but uses deprecated flags. Note that in Java 8, the address parameter only accepts a port
number, not the *:port format.
Common Config Scenarios
Docker Containers
When running Java applications in Docker, expose the debug port and configure the JVM arguments:
# Dockerfile
FROM eclipse-temurin:25
COPY target/myapp.jar /app/myapp.jar
EXPOSE 8080 5005
ENTRYPOINT ["java", "-agentlib:jdwp=transport=dt_socket,server=y,suspend=n,address=*:5005", "-jar", "/app/myapp.jar"]
Then map the port when running:
docker run -p 8080:8080 -p 5005:5005 myapp
Spring Boot
For Spring Boot apps, you can pass the debug arguments through Maven or Gradle:
# Maven
mvn spring-boot:run -Dspring-boot.run.jvmArguments="-agentlib:jdwp=transport=dt_socket,server=y,suspend=n,address=*:5005"

# Gradle
gradle bootRun --debug-jvm
The Gradle --debug-jvm flag automatically configures remote debugging on port 5005 with suspend=y, so the application will
wait for a debugger before starting.
Environment Variables
Many application servers and deployment platforms let you set JVM options through environment variables:
# Generic Java applications
export JAVA_OPTS="-agentlib:jdwp=transport=dt_socket,server=y,suspend=n,address=*:5005"

# Spring Boot with environment variable
export JAVA_TOOL_OPTIONS="-agentlib:jdwp=transport=dt_socket,server=y,suspend=n,address=*:5005"
The JAVA_TOOL_OPTIONS var is automatically picked up by the JVM without needing to explicitly pass it to the java command.
Connecting from IntelliJ IDEA
Once your Java application is running with remote debugging enabled, you want to actually step through and inspect things. This basically means you need to attach IntelliJ to it:
- Create a Remote JVM Debug Configuration
- Go to
Run→Edit Configurations - Click the
+button and selectRemote JVM Debug - Give it a descriptive name like “Remote Debug - Staging”
- Go to
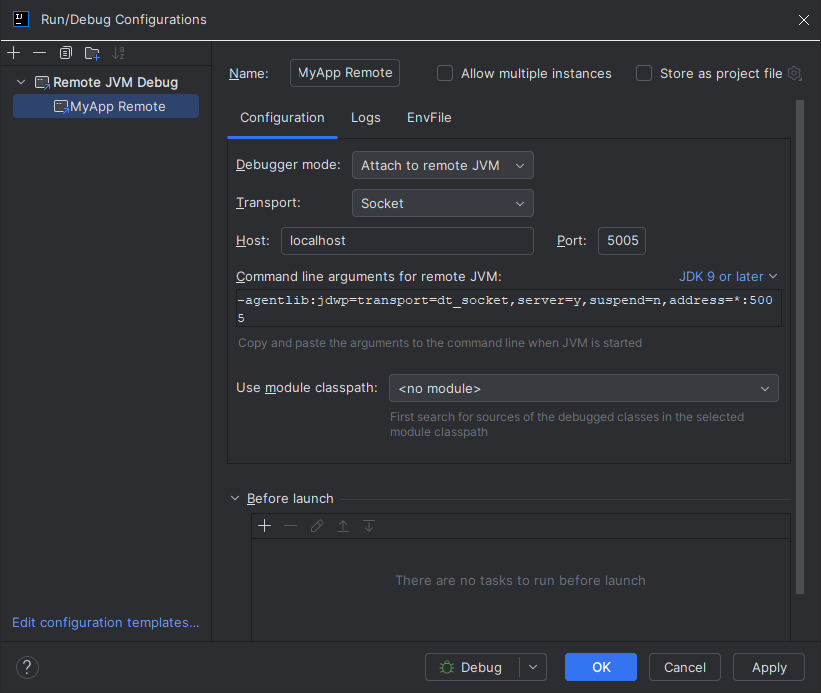
- Configure the Connection
- Debugger mode: Select
Attach to remote JVM(the default) - Host: Enter the hostname or IP address of the machine running your Java application (use
localhostif debugging a local Docker container) - Port: Enter the debug port (typically
5005) - Command line arguments: IntelliJ shows you the JVM arguments needed - useful for reference but not required here
- Debugger mode: Select
- Set Module Classpath
- Under “Use module classpath”, select the appropriate module
- This ensures IntelliJ can map the remote code to your local source files
- Start Debugging
- Click
Debugor pressShift + F9 - Set breakpoints in your code
- Trigger the code path in the remote application (make an HTTP request, send a message, etc.)
- IntelliJ will pause execution when breakpoints are hit
- Click
When the debugger attaches successfully, you’ll see a message in the Debug console: "Connected to the target VM, address: '
hostname:5005', transport: 'socket'".
Some Considerations
Source Code Synchronization
Remote debugging requires that your local source code matches the bytecode running remotely. If the versions don’t match, you’ll see incorrect line numbers, unexpected behavior, or the debugger won’t stop at breakpoints.
Performance Impact
Remote debugging does have a performance overhead, particularly when:
- Stepping through code line by line
- Evaluating complex expressions
- Inspecting large objects or collections
- Using conditional breakpoints
AKA don’t do it in production.
Security
Opening a debug port exposes your application to potential security risks. Anyone who can connect to the debug port has full control over the JVM, including the ability to execute arbitrary code and access sensitive data.
Best practices:
- Never expose debug ports directly to the internet
- Use
address=localhost:5005instead ofaddress=*:5005when possible, then use SSH tunneling to connect - Only enable remote debugging in non-production environments, or very temporarily in production with strict access controls
- Use firewalls and security groups to restrict access to the debug port
- Disable debugging after troubleshooting is complete
AKA don’t do it in production.
SSH Tunneling
For remote servers, SSH tunneling can provide a secure way to access the debug port:
ssh -L 5005:localhost:5005 user@remote-server
This forwards your local port 5005 to the remote server’s localhost:5005. Configure your IntelliJ debug connection to use
localhost:5005, and the connection will be tunneled securely through SSH.
More Reading
- Java Platform Debugger Architecture (JPDA) - Official Oracle documentation
- IntelliJ IDEA Remote Debugging Tutorial - JetBrains official guide
- Docker Java Remote Debugging - Docker blog post on Java debugging