Gathering Metrics with Micrometer and Spring Boot Actuator
06 Jan 2021Note: Also check out this follow-up post which covers how to query and create reusable dashboards from your metrics: Aggregating and Visualizing Spring Boot Metrics with Prometheus and Grafana
Why Metrics?
Metrics, alongside tracing and logging, form the concept of observability - one of the key cornerstones of DevOps - so hopefully it should be of no surprise to anyone of its importance. As we build larger and more distributed platforms, maintaining sufficient visibility into what the system is doing, when it’s doing it and how well it’s performing becomes more difficult, but also more vital. We can likely no longer just directly query the application for these measurements anymore. Instead, we require aggregations across all our service instances, as well as the ability to drill-down into particular aspects of a metric to gain most insight.
The usefulness of metrics also goes well past just capturing overall system health and resource usage. We can still observe common things like memory and CPU usage, garbage collection and thread utilization metrics - from the SRE perspective these can still go a long way to monitor and manage a production system - but we should also be looking to go much further than just machine level statistics. Well-defined business level metrics, collected automatically by our applications in real-time, are a prerequisite to both our ability to define and measure against SLA’s/SLO’s, alongside our ability to make well informed, data-driven decisions as part of the wider Agile process.
Micrometer
Libraries and frameworks for gathering metrics are nothing new in the Java world. Things like Dropwizard have been around for many years now, but more recently Micrometer has taken a more prominent position - and for good reason. In a lot of ways it supersedes the alternatives.
Micrometer provides a simple facade over the instrumentation clients for the most popular monitoring systems, allowing you to instrument your JVM-based application code without vendor lock-in. Think SLF4J, but for metrics.
The above description is straight from the Micrometer website and I think the SLF4J analogy sums it up quite well. Just like for logging where we use the core API from SLF4J and then pick and choose whichever concrete logging library we want (Logback, Log4J), the same applies here, but for metrics. The core Micrometer library provides the API’s and interfaces for defining timers, gauges, counters (and more), but out-of-the-box doesn’t do too much more than just store them in memory. After you have defined your metrics, you can then plug-in connectors for a number of external monitoring systems or time-series databases - Azure Monitor, Netflix Atlas, Datadog, Graphite, InfluxDB, Prometheus or even just simple JMX. The main facade stays intact, which then quite rightly decouples the collection of metrics from any/all external consumers.
A nice and modern API is all well and good, but perhaps the larger points to mention here are its support for dimensional metrics (see below) and the first-party support from Spring. From Spring Boot 2.0 (1.x used Dropwizard) each component is integrated with Micrometer and will automatically publish metrics out-of-the-box (again, more on this below).
Hierarchical vs. Dimensional Metrics
Traditionally, metrics have really been not much more than just simple key/value pairs - where the key is usually some dot-separated string namespaced into a particular application area and the value being a simple numerical measurement. This is what’s known as a hierarchical metric, where as the key gets longer, the measurement gets more specific. This used to be the way that most libraries captured metrics and indeed is how Dropwizard and Spring Boot 1.x function. Hierarchical metrics do however have a large limitation - consider the below keys for capturing metrics for HTTP endpoints:
http.requests
http.requests.getwidgets
http.requests.getwidgets.region
http.requests.getwidgets.region.200
http.requests.getwidgets.region.200.username
http.requests.getwidgets.region.200.username.duration
...
From the top metric we measure the most general aggregate - total number of HTTP requests served - and then get gradually more specific by introducing additional fields. These tend to make the metric more insightful, as we are likely going to need to drill-down to a specific region/datacentre or endpoint name and then find the total number of 200 or 500 responses for example. Hopefully you can see the issue here - as we add more fields, the number of metrics we gather starts to grow and grow. The above example is just for a single endpoint, username and status code, they can quickly start to multiply as your system is used. This is what’s known as a cardinality explosion and something to be careful of in applications using hierarchical metrics. It can increase resource consumption and cause pressure on the external systems trying to consume and report on them.
The case for hierarchical metrics gets worse though as the final measurement is tied to the full key. This is fine if it represents exactly what you’re looking for - in the above example, perhaps reporting on the total number of 200 responses for the getwidgets endpoint in a particular region is helpful - but what if you need a different combination?
- total number of 200 responses served (not just
getwidgets) - total number of requests made by a particular username (independent of endpoint or status code)
- overall duration spent handling
getwidgetsrequests (independent of status code or region)
With this set of metrics the above questions are not trivial to answer. You would either be forced to create even more metrics specific to these cases (making the aforementioned cardinality explosion worse), or be forced to perform complex extra aggregation steps in your reporting tool of choice
The idea of dimensional metrics aims to solve these issues and overall make your metrics considerably more powerful. Instead of including fields directly in the key, these are instead added as tags to a more general base metric. The equivalent for the above hierarchical metrics becomes:
http.requests
	endpoint: getwidgets
	method: GET
	status: 200
	username: ryan
	region: rr
This kind of structure is supported out-of-the-box by Micrometer, whereby each tag (or dimension) is added as a parameter in each measurement. The connectors also understand how to send these metrics down to your monitoring system of choice, be it Prometheus which supports dimensional metrics, or just JMX (in which case the dimensional metrics will be flattened out).
The real benefit of dimensional metrics comes into play when partnered with a time series database (such as Prometheus). This allows for the ability to drill-down across dimensions at will, without introducing any of the downsides of hierarchical metrics. Going back to the example above, you can add specific predicates on any number of dimensions and get out the expected aggregation directly. Answering a complex query like “give me all the 500 responses from the getwidgets endpoint, across all regions and from users X,Y and Z from the last 24hrs and compare against the same data from yesterday” becomes trivial.
Spring Integration
As I mentioned before, Micrometer is integrated with Spring Boot Actuator and so requires just the single dependency to get running:
implementation 'org.springframework.boot:spring-boot-starter-actuator'
The Spring Boot Actuator starter dependency does a number of useful things which I’ll cover in future posts, but for now we’ll focus just on the metrics support. By default, Spring configures bindings to begin automatically publishing core metrics across many areas:
- JVM - memory, buffer pools, thread utilization, classes loaded
- CPU and File Descriptor usage
- Logback - number of events logged at each level
- Spring MVC - HTTP requests/responses and errors
- HTTP Clients - instrumentation on
RestTemplateorWebClientinstances - Kafka - native metrics on all configured producers/consumers
- Data Sources -
HikariCPbindings for connection pool size and usage - Caches -
Caffeine/JCachebindings for hit/miss counts, sizes
Hopefully you will agree that this is a fairly comprehensive list already for out-of-the-box behaviour (just dependant on which beans you have created in your app), and this is before you have created any of your own custom metrics.
Publishing Metrics
To try these features out we’ll create a quick contrived demo app to test some of the integration areas. First of all the main Spring app config:
@EnableCaching
@Configuration
public class AppConfig {

    @Value("${spring.application.name}")
    private String applicationName;

    @Bean
    public MeterRegistryCustomizer<MeterRegistry> metricsCommonTags() {
        return registry -> registry.config().commonTags("region", "us-east-1", "application", applicationName);
    }

    @Bean
    public CacheManager cacheManager() {
        CaffeineCacheManager cacheManager = new CaffeineCacheManager();
        cacheManager.setCaffeine(Caffeine.newBuilder().recordStats());
        cacheManager.setCacheNames(Collections.singletonList("widgetCache"));
        return cacheManager;
    }

    @Bean
    public RestTemplate restTemplate(RestTemplateBuilder restTemplateBuilder) {
        return restTemplateBuilder.build();
    }

}
There are a few things going on here:
- we use a Spring
MeterRegistryCustomizerbean to add a common set of tags to all metrics that get published. This is useful to attach instance level details, such as application name and region/datacentre that the service is running in. - we create a
CacheManagerbean usingCaffeineas the underlying caching mechanism. TherecordStats()portion instructsCaffeineto record metrics thatMicrometercan then bind to (also make sure to@EnableCaching). - we create a standard
RestTemplatebean, making sure to to use theRestTemplateBuilderso that the metrics instrumentation gets added.
Next is a simple @Service class to give something for our endpoints to call:
@Service
@RequiredArgsConstructor
public class WidgetService {

    private static final Logger log = LoggerFactory.getLogger(WidgetService.class);
    private final RestTemplate restTemplate;

    @Cacheable("widgetCache")
    public String getWidgets(String user) {
        log.info("Finding widgets for {}", user);
        if(user.equals("bill")) return "widget 1";
        if(user.equals("bob")) return "widget 2";
        else {
            log.error("Could not find widgets for {}", user);
            throw new IllegalArgumentException("Unknown user");
        }
    }

    public String saveWidget(String input) {
        ParameterizedTypeReference<Map<String, String>> responseType = new ParameterizedTypeReference<>() { };
        log.info("Saving widget with input: {}", input);
        ResponseEntity<Map<String, String>> responseEntity =
                restTemplate.exchange("https://httpbin.org/uuid?param={input}", HttpMethod.GET, null, responseType, input);
        log.info("Successfully saved widget!");
        return responseEntity.getBody().get("uuid");
    }
}
Nothing too interesting here. There is a simple getWidgets method to return some static data based on our user input (which also uses our new cache manager). There is a path to generate an exception so we can ensure the corresponding metrics are created. We also make use of the RestTemplate to call a test endpoint from httpbin.org to generate a a basic UUID (simulating some system latency).
Finally, there are two very simple endpoints that just call our service class (and generate some HTTP request metrics):
@RestController
@RequiredArgsConstructor
public class WidgetEndpoint {

    private final WidgetService widgetService;

    @GetMapping(value = "/widgets", produces = "text/plain")
    public ResponseEntity<String> getWidgets(@RequestParam("user") String user) {
        return ResponseEntity.ok(widgetService.getWidgets(user));
    }

    @PostMapping(value = "/widgets", produces = "text/plain")
    public ResponseEntity<String> saveWidget(@RequestParam("input") String input) {
        return ResponseEntity.ok(widgetService.saveWidget(input));
    }
}
If you build, run the app and hit the endpoints, they will work as expected, but we don’t yet have a way to confirm any metrics actually get created.
Spring Boot Actuator Metrics
The Spring Boot Actuator comes built-in with a number of endpoints we can use to manage our application. One of these allows you to view and query all the metrics generated by your application, but it’s disabled by default. Add the following to application.properties to enable it:
spring.application.name=widgetservice
management.endpoints.web.exposure.include=metrics
If you now visit http://localhost:8080/actuator/metrics in your browser, actuator will give you a list of all the top-level metrics (filtered below for brevity).
{
    "names": [
        "cache.gets",
        "cache.size",
        "http.server.requests",
        "jvm.buffer.memory.used",
        "jvm.classes.loaded",
        "jvm.gc.pause",
        "jvm.memory.max",
        "jvm.memory.used",
        "jvm.threads.live",
        "logback.events",
        "process.cpu.usage",
        "process.uptime",
        "system.cpu.usage",
        "tomcat.sessions.active.current",
        "tomcat.sessions.active.max"
    ]
}
Most of these should look familiar when compared with the list we saw before - they are metrics publishing automatically by our application without having to perform any real work. The actuator metrics endpoint also lets you view specific metrics: http://localhost:8080/actuator/metrics/jvm.memory.used
{
    "name": "jvm.memory.used",
    "description": "The amount of used memory",
    "baseUnit": "bytes",
    "measurements": [
        {
            "statistic": "VALUE",
            "value": 89722280
        }
    ],
    "availableTags": [
        {
            "tag": "area",
            "values": ["heap", "nonheap"]
        },
        {
            "tag": "application",
            "values": ["widgetservice"]
        },
        {
            "tag": "id",
            "values": [
                "G1 Old Gen",
                "CodeHeap 'non-profiled nmethods'",
                "G1 Survivor Space",
                "Compressed Class Space",
                "Metaspace",
                "G1 Eden Space",
                "CodeHeap 'non-nmethods'"
            ]
        },
        {
            "tag": "region",
            "values": ["us-east-1"]
        }
    ]
}
At the top we can see the aggregate measured value for total memory used and then we can also see a number of tags/dimensions associated with it (including the common set we added in the app config). This is where dimensional metrics get interesting, as you can now drill-down specifically into particular areas. For example, to view just heap memory usage: http://localhost:8080/actuator/metrics/jvm.memory.used?tag=area:heap
{
    "name": "jvm.memory.used",
    "description": "The amount of used memory",
    "baseUnit": "bytes",
    "measurements": [
        {
            "statistic": "VALUE",
            "value": 47795248
        }
    ],
    "availableTags": [
        {
            "tag": "id",
            "values": ["G1 Old Gen", "G1 Survivor Space", "G1 Eden Space"]
        }
    ]
}
This gives us a more specific measurement and a different set of tags that we could use to further drill-down into the metric e.g. http://localhost:8080/actuator/metrics/jvm.memory.used?tag=area:heap&tag=id:G1%20Eden%20Space to inspect the total memory used in the heap G1 Eden Space only.
Cache Metrics
Now to actually call some of our own code to generate some other metrics. We can use the getWidgets endpoint to make use of our cache: http://localhost:8080/widgets?user=bill. If we call that multiple times, we should be getting the result straight from the cache instead of calling the method itself. We can consult the cache metrics to confirm: http://localhost:8080/actuator/metrics/cache.gets?tag=cache:widgetCache&tag=result:hit
{
    "name": "cache.gets",
    "description": "The number of times cache lookup methods have returned a cached value.",
    "baseUnit": null,
    "measurements": [
        {
            "statistic": "COUNT",
            "value": 3
        }
    ],
    "availableTags": [
        {
            "tag": "name",
            "values": ["widgetCache"]
        }
    ]
}
Here we are using the the cache.gets metric, with tag predicates on the cache name and result, in order to assess how well our cache is utilized. Similarly, you could also inspect the misses tag to generate the cache hit/miss ratio. You can also use the cache.size metric to observe trends in how many values are in loaded into your caches: http://localhost:8080/actuator/metrics/cache.size?tag=name:widgetCache
HTTP Client Metrics
Next up we can call the saveWidget endpoint to make use of our instrumented RestTemplate to call an external service: http://localhost:8080/widgets?input=something. If you call the /actuator/metrics endpoint again, you should see a new entry http.client.requests:
{
    "name": "http.client.requests",
    "description": "Timer of RestTemplate operation",
    "baseUnit": "seconds",
    "measurements": [
        {
            "statistic": "COUNT",
            "value": 1
        },
        {
            "statistic": "TOTAL_TIME",
            "value": 0.6493909
        },
        {
            "statistic": "MAX",
            "value": 0.6493909
        }
    ],
    "availableTags": [
        {
            "tag": "method",
            "values": ["GET"]
        },
        {
            "tag": "clientName",
            "values": ["httpbin.org"]
        },
        {
            "tag": "uri",
            "values": ["/uuid?param={input}"]
        },
        {
            "tag": "outcome",
            "values": ["SUCCESS"]
        },
        {
            "tag": "status",
            "values": ["200"]
        }
    ]
}
The previous metrics we’ve looked at were simple counters or gauges, but now we have timer which gives us more measurement values. Not only do you get the count, but also the total time taken (allowing you to compute averages) and a max observed value. The tags are also more interesting here - similar to the above you can easily drill-down to answer some interesting questions:
- how many requests where made to client X in total within a certain time period?
- how many requests where made to the
/uuidendpoint on client X which failed? - how long did the application spend waiting for client X to respond to our calls?
HTTP Request Metrics
By now we should have produced enough traffic to generate some good HTTP request metrics. You could also call the getWidgets endpoint with an unknown user to generate an exception: http://localhost:8080/widgets?user=none. The http.server.requests metric is used to capture measurements for our HTTP endpoints:
{
    "name": "http.server.requests",
    "description": null,
    "baseUnit": "seconds",
    "measurements": [
        {
            "statistic": "COUNT",
            "value": 23
        },
        {
            "statistic": "TOTAL_TIME",
            "value": 0.7761524969999999
        },
        {
            "statistic": "MAX",
            "value": 0.0031665
        }
    ],
    "availableTags": [
        {
            "tag": "exception",
            "values": ["None", "IllegalArgumentException", "BadOperationRequestException"]
        },
        {
            "tag": "method",
            "values": ["GET", "POST"]
        },
        {
            "tag": "uri",
            "values": ["/saveWidget", "/getWidgets", "/actuator/metrics", "/**"]
        },
        {
            "tag": "outcome",
            "values": ["CLIENT_ERROR", "SUCCESS", "SERVER_ERROR"]
        },
        {
            "tag": "status",
            "values": ["404", "200", "400", "500"]
        }
    ]
}
Similarly to the http.client.requests metric, we have a timer meter and a number of useful tags to inspect:
- how many requests resulted in
500status codes within a certain time period? - how many times was a
POSTrequest made to the/widgetresource? - how many requests made to the
/widgetresource resulted inIllegalArgumentException? - how long did it take to respond to all
GETrequests which resulted in500status codes?
Logging Metrics
A perhaps lesser known, but I think very useful metric is logback.events which keeps track of all lines that were logged and at what level. We can then query for example just for ERROR log lines across generated over time: http://localhost:8080/actuator/metrics/logback.events?tag=level:error:
{
    "name": "logback.events",
    "description": "Number of error level events that made it to the logs",
    "baseUnit": "events",
    "measurements": [
        {
            "statistic": "COUNT",
            "value": 4
        }
    ]
}
DataSource Metrics
Finally, we have metrics produced by any JDBC DataSource instances available in our app. This can be done either through the Spring Boot spring.datasource auto-configuration, or creating your own. HikariCP exposes a number of metrics over it’s connection pool, such as hikaricp.connections.usage and hikaricp.connections.idle. This can be helpful if you’re trying to track down connection pool exhaustion issues in your applications.
Creating Custom Metrics
All the built-in Spring metrics are great, but you will also need to create and publish your own custom metrics. Spring creates a Micrometer MeterRegistry instance by default, that you can then inject and use to create custom counters, gauges and timers. As a very simple and contrived example, we can create some counters in our widget service:
private final MeterRegistry meterRegistry;

public String getWidgets(String user) {
    log.info("Finding widgets for {}", user);
    if(user.equals("bill")) {
        meterRegistry.counter("custom.widgets", "user", "bill").increment();
        return "widget 1";
    }
    if(user.equals("bob")) {
        meterRegistry.counter("custom.widgets", "user", "bob").increment();
        return "widget 2";
    }
    else {
        log.error("Could not find widgets for {}", user);
        throw new IllegalArgumentException("Unknown user");
    }
}
Here we use our injected MeterRegistry to create a new counter called widgets (this will be the base name of your metric). We also provide a custom tag for our metric so we can then filter based on username. Note that you generally don’t want to create tags where there can be too many possible values. In the example above, we know there can only ever be two, but with too many it can cause some resource usage issues.
Once the metric is published, you should be able to see it show up in actuator just like any other metric: http://localhost:8080/actuator/metrics/custom.widgets
{
    "name": "custom.widgets",
    "description": null,
    "baseUnit": null,
    "measurements": [
        {
            "statistic": "COUNT",
            "value": 2
        }
    ],
    "availableTags": [
        {
            "tag": "user",
            "values": ["bob", "bill"]
        }
    ]
}
Since it’s a counter meter, we just have the single measurement alongside the custom user tag that we passed in. We could then drill-down as needed into how many widgets a specific user had asked for etc. (note in this case the max is always 2 since we have used the @Cacheable annotation).
Finally, in Spring Boot we can also create a custom timer surrounding a method call using the @Timed annotation. You also need to create an aspect bean for Micrometer to recognise and instrument the methods:
@Bean
public TimedAspect timedAspect(MeterRegistry registry) {
    return new TimedAspect(registry);
}

@Timed
public String saveWidget(String input) {}
We can then view the timing data in the method.timed base metric, which can be filtered down by tags on class and method names: http://localhost:8080/actuator/metrics/method.timed?tag=method:saveWidget
{
    "name": "method.timed",
    "description": null,
    "baseUnit": "seconds",
    "measurements": [
        {
            "statistic": "COUNT",
            "value": 3
        },
        {
            "statistic": "TOTAL_TIME",
            "value": 1.0327454
        },
        {
            "statistic": "MAX",
            "value": 0.600250599
        }
    ],
    "availableTags": [
        {
            "tag": "exception",
            "values": ["none"]
        },
        {
            "tag": "class",
            "values": ["com.example.demo.WidgetService"]
        }
    ]
}
This just scratches the surface of the Micrometer API to define your own metrics. Take a look at the docs page https://micrometer.io/docs/concepts which goes into more detail about each available meter type.
Aggregation and Visualization
See this follow-up post for a complete look at visualizing Spring Boot metrics: Aggregating and Visualizing Spring Boot Metrics with Prometheus and Grafana
Capturing and publishing metrics is one thing, but in a multi-instance environment we also need some way of aggregating all the measurements and allow us to visualize state across the whole platform. The built-in Spring Boot Actuator endpoint is useful as a quick admin tool, but generally we need to use the Micrometer connectors and other external monitoring tools to get the full benefits. There are a lot of options here, but Prometheus tends to be the go-to as a time series database and monitoring tool. For Spring based apps, you just need to add the appropriate Micrometer dependency and the rest is handled for you:
implementation 'io.micrometer:micrometer-registry-prometheus'
Actuator will then expose a dedicated /actuator/prometheus endpoint which can be called by Prometheus to gather the latest measurements (requires extra config not covered here). There are generally two ways to get your metrics into a time series database - the push model or the pull model. In the push model, your application itself has to send all your metrics downstream. This might result in slightly more real-time measurements, but also introduces issues if the monitoring tool becomes unavailable. Your app might be continuously blocking a thread trying to publish historical metrics downstream, even though it may be down or otherwise overwhelmed. Additionally, you also introduce unneeded coupling between your application and the external monitoring tooling. In the push model, which tools like Prometheus favour, your application exposes a simple and optimized endpoint for your metrics and then it’s the responsibility of the external tool to continuously poll for the latest measurements. Crucially, this minimises any negative impact to your application itself and avoids the coupling. It does however require a service discovery mechanism (such as Eureka or Zookeeper) to be configured in order for the tooling to pull metrics from each of the application instances.
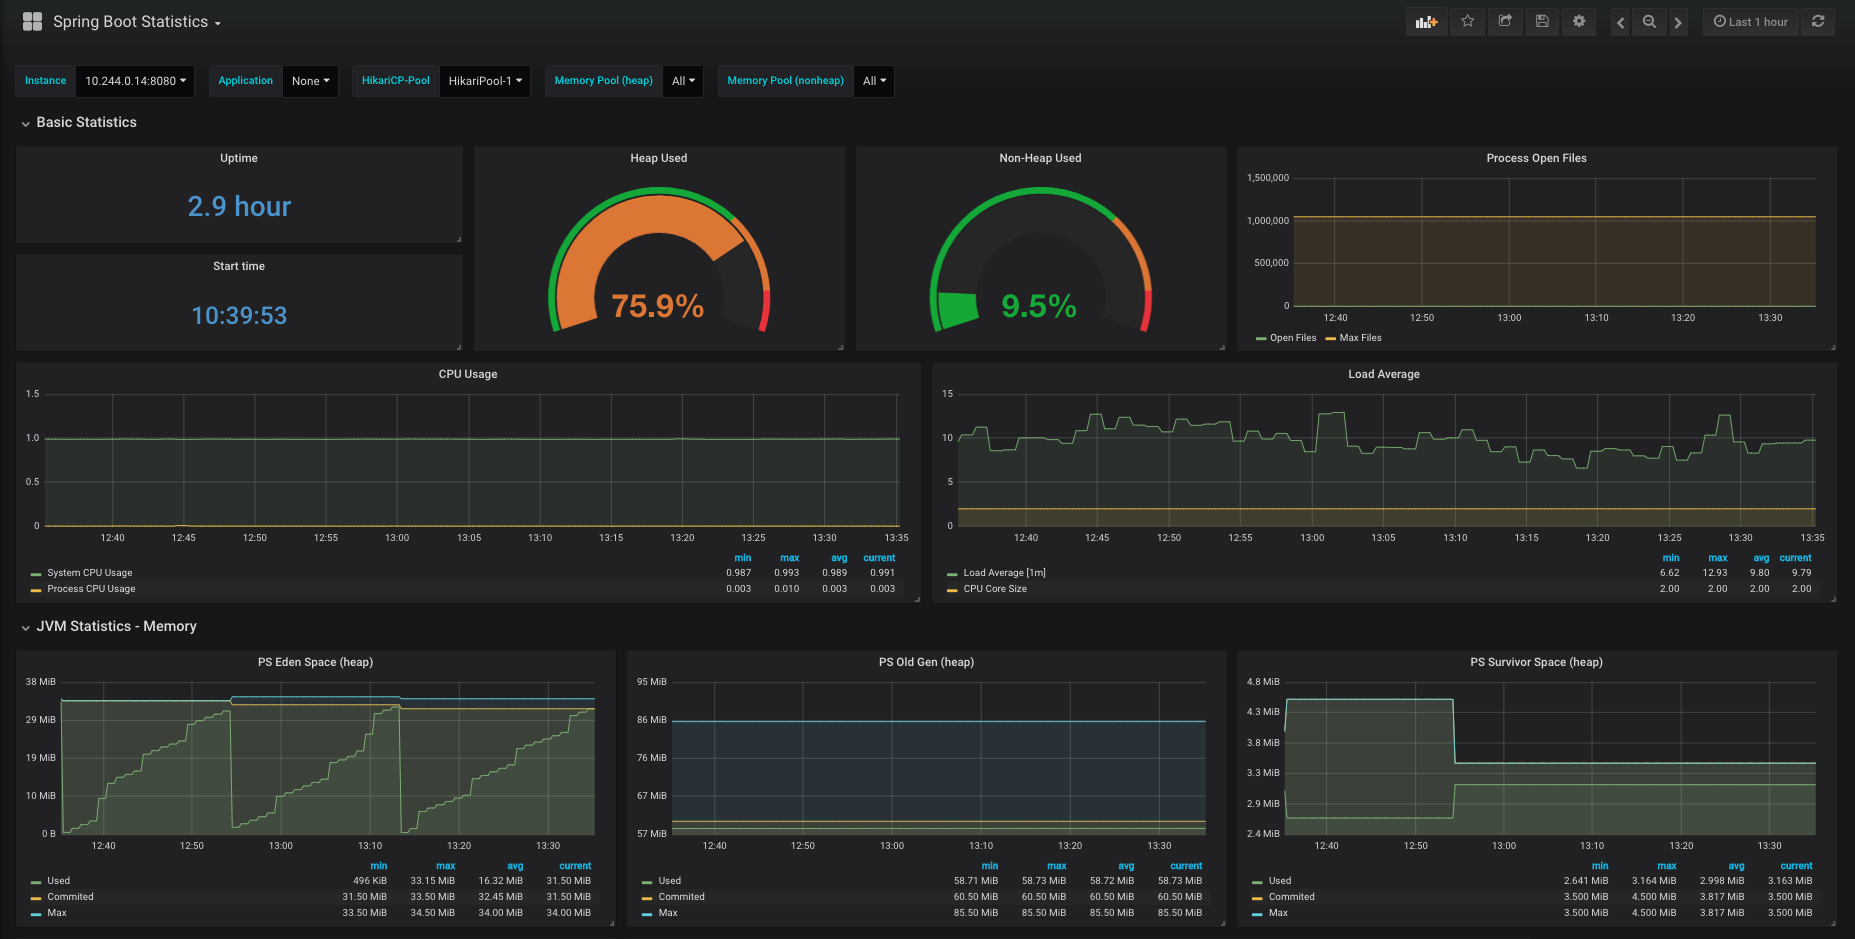
Prometheus provides it’s own basic visualization tooling, but instead Grafana can be used as another layer in the stack to offer rich querying and graphing feature sets, alongside alerting and reporting. Prometheus still stores the raw data, but you can put together dashboards in Grafana, such as the one below for a generic Spring Boot app.
Takeaways (TL;DR)
- metrics are an essential part of any application, not only in assessing health and stability, but also to make data-informed decisions on the future direction of your application
- for JVM based apps,
Micrometeris the way to go for metrics collection (especially when using Spring) - dimensional metrics are extremely powerful - and resolve longstanding issues with conventional hierarchical metrics
Spring Boot 2+andSpring Actuatorhave great built-in support for metrics withMicrometerand out-of-the-box integration for a number of key areas- default application metrics should only form part of the overall picture and must be partnered with business level metrics - which are well-defined against established and agreed SLA’s
- an external time series database such as
Prometheusshould be used to aggregate metrics across all application instances and allow tools such asGrafanato provide dynamic visualisations on top of the underlying data.
Useful links: