Aggregating and Visualizing Spring Boot Metrics with Prometheus and Grafana
02 Jun 2021Note: this is a follow-up post covering the collection and visualization of Spring Boot metrics within distributed environments. Make sure to take a look at Gathering Metrics with Micrometer and Spring Boot Actuator which outlines using Micrometer to instrument your application with some of the built-in Spring Boot integrations and how to start defining and capturing custom metrics.
From the previous part we should now have a Spring Boot application that is capable of capturing a variety of dimensional metrics, but is of limited use since it only stores these values locally within it’s own Micrometer MetricsRegistry. We can use the built-in Spring actuator endpoints to perform simple queries on these metrics, but this alone is not meant as a complete monitoring tool. We don’t have any access to historical data and we need to query the instances directly - not something which is viable when running many (perhaps ephemeral) instances.
Prometheus and Grafana (also sometimes known as Promstack) is a popular and open source stack which aims to solve these problems and provide a complete platform for observing metrics in widely distributed systems. This includes tracking metrics over time, creating complex queries based on their dimensions/tags, aggregating across many instances (or even across the whole platform), raising alerts based on predefined criteria and thresholds, alongside the creation of complex visualizations and dashboards with Grafana.
Basic Architecture
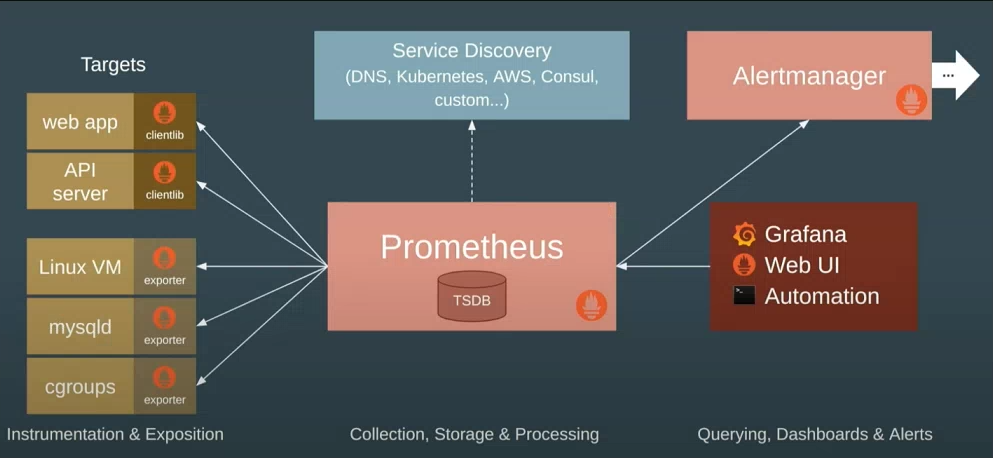
Below is a quick diagram taken from a talk given by one of the Prometheus founders and gives a good summary view of how Prometheus/Grafana work together and integrate with your systems. I would definitely recommend watching for some more background: https://www.youtube.com/watch?v=5O1djJ13gRU
Prometheus
At the centre is Prometheus which provides the core backbone for collection and querying. It’s based on it’s own internal times series database and is optimized specially for consumption and reporting of metrics. It can be used to monitor your hosts, applications or really anything that can serialize metrics data into the format that it can then pull from.
Crucially, Prometheus supports the dimensional data model that attaches labels/tags to each captured metric. For more details see Part 1 which covers some of the advantages over conventional hierarchical metrics, but in short for example if you were capturing the total number of HTTP requests, you would attach labels to each time series value allowing you to then query and aggregate based on source process, status code, URL etc. The underlying time series database is very well optimized around labelled data sets, so is able to efficiently handle frequent changes in the series’ dimensions over time (e.g for pod names or other ephemeral labels).
Prometheus operates in a pull model, so unlike other solutions whereby your application has to push all of its metrics to a separate collector process itself, Prometheus is instead configured to periodically scrape each of your service instances for the latest meter snapshot. These are then saved into the time series database and become immediately available for querying. Depending on the scrape interval and underlying observability requirements, this can potentially give you close to real-time visibility into your apps.
Rather than having to hardcode host names, Prometheus can integrate directly into your service discovery mechanism of choice (somewhat limited at the moment focusing on cloud offerings, but there are ways around it) in order to maintain an updated view of your platform and which which instances to scrape from. At the application level the only requirement is an endpoint exposing your metrics in the textual serialization format understood by Prometheus. With this approach your app need not know about whatever monitoring tools are pulling metrics - helping to decouple it from your observability stack. You also don’t need to worry about applying collection backpressure and handling errors like may need to in the push model, if for example the monitoring tool starts to become overwhelmed.
Prometheus provides its own dynamic query language called PromQL which understands each major metric type: Counters, Gauges, Summaries and Histograms. This is the main entry point into the underlying time series data and allows you to perform a wide variety of operations on your metrics:
- binary operations between time series
- rates over counters - taking into account service restarts
- filtering the time series by any provided dimension/label
- aggregating summary stats to create cumulative histograms
These queries can be used to support graphs and dashboards, or also to create alerts in conjunction with the AlertManager component (if for example certain thresholds are breached by an aggregated query across instances).
Grafana
Prometheus is bundled with it’s own simple UI for querying and charting its time series data, but doesn’t come close to the flexibility offered by Grafana which is probably the most well known visualization and dashboarding tool out there. Grafana has deep integrations with Prometheus, allowing you to configure it as a data source like you would any other upstream store (the default is even Prometheus now) and then write your own PromQL queries to generate great looking charts, graphs and dashboards.
Following on with the config-as-code approach, all of your Grafana dashboards can also be exported as JSON files which makes sharing considerably easier. For JVM/Spring based applications there are many community dashboards already available that you can begin utilizing immediately (or otherwise as a decent starting point for your own visualizations).
Micrometer / Prometheus Exporter
Since Prometheus operates in a pull model, we need our Spring Boot application to expose an HTTP endpoint serializing each of our service metrics. As discussed in the previous part, this is where Micrometer comes into it’s own. Since it acts as a metrics facade, we can simply plug in any number of exporters that provide all the necessary integrations - with zero changes needed to our actual application code. Micrometer will take care of serializing it’s local store (and maybe pushing) into whatever formats required - be it Prometheus, Azure Monitor, Datadog, Graphite, Wavefront etc.
For our basic Spring Boot application, the actuator endpoint does something similar to this, but it doesn’t offer the correct format for Prometheus to understand. Instead, we can add the below library provided by Micrometer to enable the required exporter functionality:
implementation("io.micrometer:micrometer-registry-prometheus")
In other apps you would need to manually setup an endpoint integrating with your local MetricsRegistry, but in this case Spring Boot sees this library on the classpath and will automatically setup a new actuator endpoint for Prometheus. These are all disabled by default so we also need to expose it through a management property:
management.endpoints.web.exposure.include=metrics,prometheus
If you start the application, now you should be able to visit http://localhost:8080/actuator/prometheus to see the serialized snapshot:
You should see each of the built-in metrics provided by Spring Boot (JVM memory usage, HTTP requests, connection pools, caches etc) alongside all of your custom metrics and tags. Taking one of these lines to examine further gives some insight into how Prometheus stores these metrics:
http_server_requests_seconds_count{application="nextservice",exception="None",method="GET",outcome="SUCCESS",status="200",uri="/actuator/info",} 1.0
In this case it’s the total number of HTTP requests serviced by our app - for now just one after I called one of the actuator endpoints. The serialized form of the counter consists of the metric name, a series of tags (representing the dimensions) and a 64-bit floating point value - all of which will be stored in the time series dataset after capture. Since Prometheus understands the dimensional nature of our metrics, we can use PromQL to perform filtering, aggregations and other calculations specific to these attributes and not the metric as a whole. The serialized form also includes metadata on the underlying meters, including a description which will be available later on as tooltips.
Setting Up Prometheus & Grafana
Prometheus is bundled as a single Go binary, so is very easy to deploy even as a standalone process, but for the purposes of this quick demo we will instead make use of the official Docker image. Refer to this post for more details about setting up and running Prometheus.
docker run -p 9090:9090 -v /path/to/prometheus.yml:/etc/prometheus/prometheus.yml prom/prometheus
The above command will run a Prometheus instance exposed on port 9090, binding the configuration YAML file from our own working directory (change as needed).
prometheus.yml
scrape_configs:
    # The job name is added as a label `job=<job_name>` to any timeseries scraped from this config.
    - job_name: "springboot"
      metrics_path: "/next/actuator/prometheus"
      scrape_interval: 5s
      static_configs:
          - targets: ["localhost:8080"] # wherever our Spring Boot app is running
The Prometheus configuration file has many options, more information at https://prometheus.io/docs/prometheus/latest/configuration/configuration/. For now though we just setup a single scrape target which tells Prometheus where to pull our metrics from - in this case a single static host, but could also be your service discovery mechanism. We also point the path to our new actuator URL and set the scrape interval.
For Grafana we can do something very similar with Docker. Refer to this article for more details about installation. Here we run a basic Grafana instance exposed on port 3000:
docker run -p 3000:3000 grafana/grafana
Using Prometheus
Visit localhost:9090 in the browser to view the Prometheus dashboard. On the Status->Targets page you should see the single static host - indicating that Prometheus is able to connect successfully and is continuously pulling metrics from our Spring Boot app:
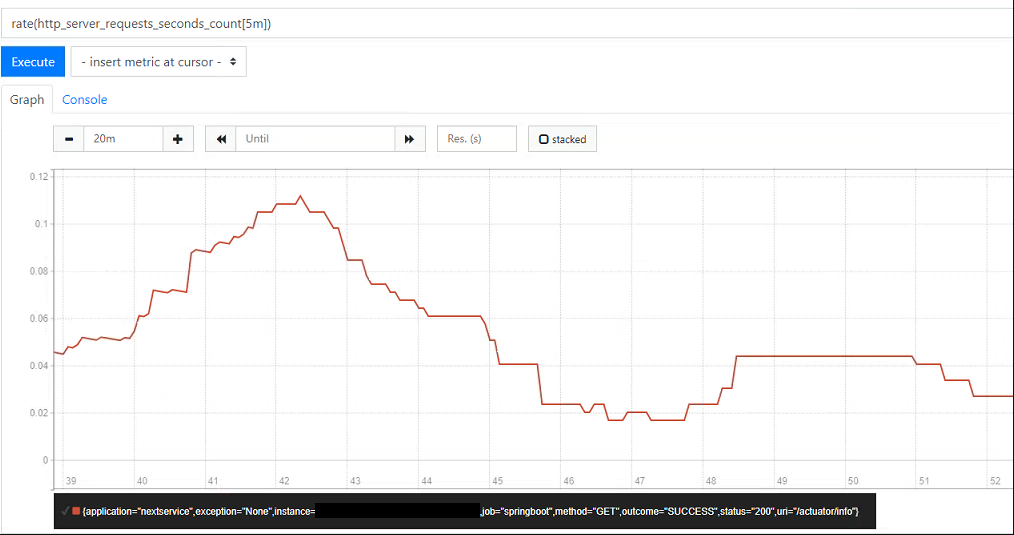
The built-in dashboard also lets you test and run PromQL expressions, the results of which can be in tabular form or as a simple graph. To test this out we can use the HTTP request counter from before to produce a close to real-time view into the traffic being handled by our app (the below returns the per second average over the last 5 minutes):
rate(http_server_requests_count[5m])
If we plot this using the graph tab and generate some load on the application, you should see the rate start to increase over time. At the bottom you should also be able to see each of the tags attached to the time series - in this case the app name, instance, URI, status code, method etc - any of these can be used to further refine the PromQL query as needed. If for example we were only interested in the count of successful requests we could instead run:
rate(http_server_requests_count{outcome="SUCCESS"}[5m])
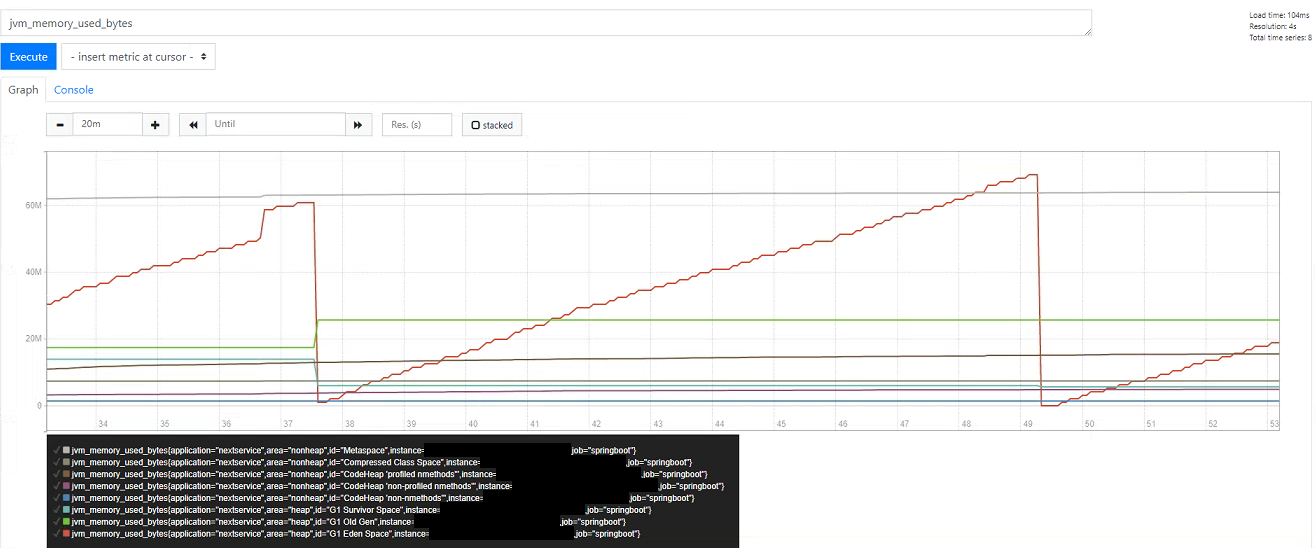
Note that the Prometheus charts don’t update themselves automatically even though the underlying data has been updated, so you need to search again periodically (Grafana does however do this). Although basic, the built-in editor is useful to explore the underlying dataset and build queries before creating dashboards. Another popular example is mapping memory usage - below we can clearly see garbage collection happening, with memory usage broken down by area and pool type (any of which could be filtered on within the PromQL query):
See this post on PromQL for a more in depth look at what it’s capable of: PromQL and Recording Rules
Using Grafana
The Prometheus graphs are useful for adhoc queries, but Grafana is significantly more powerful in terms of its capabilities for visualization and creation of summary dashboards. Visit localhost:3000 to access the instance we started alongside Prometheus. We first need to create a new datasource pointing to our Prometheus instance on the same host.
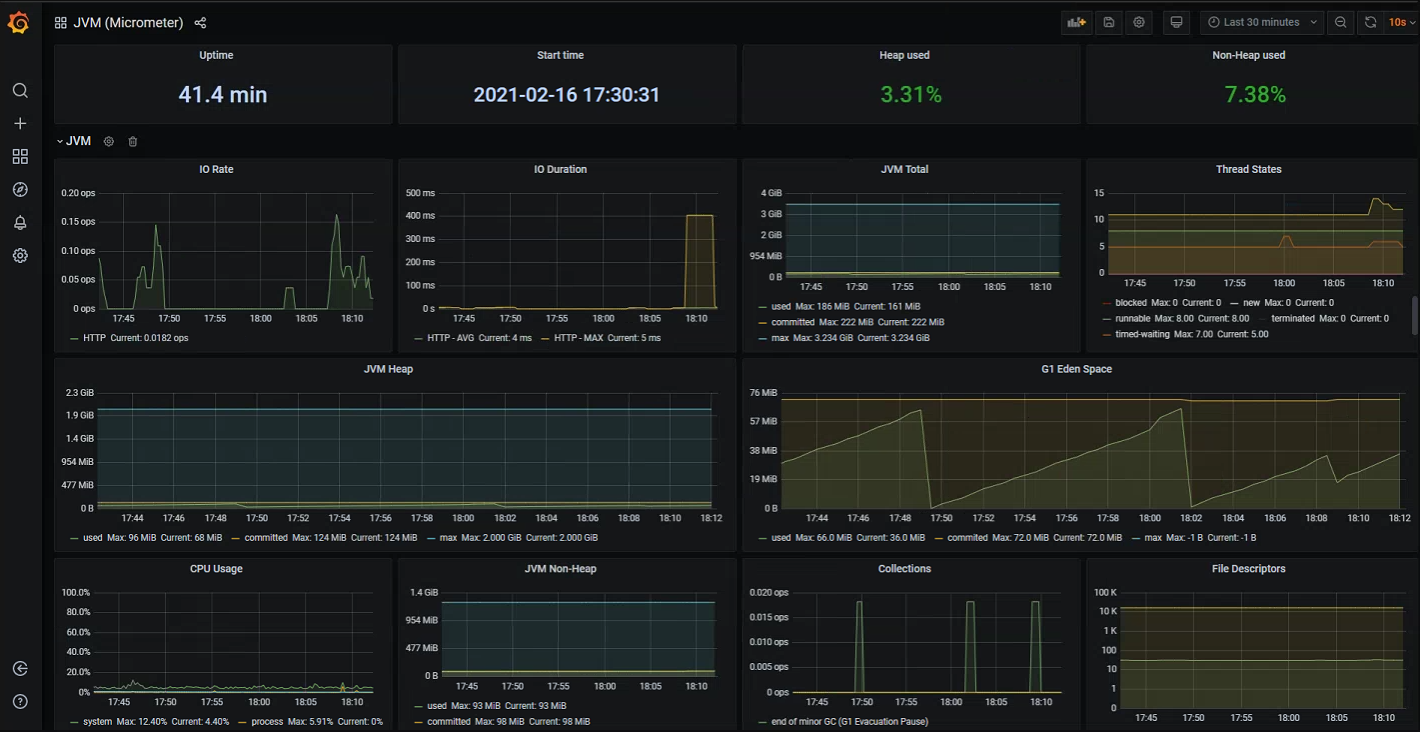
We could begin creating our own custom dashboards immediately, but one of the great things about Grafana is that there are many open source community dashboards that we can reuse in order to get going quickly. For example the below screenshot shows a general JVM application dashboard which displays many key indicators out-of-the-box. All of these are default JVM metrics that get measured and exported automatically by default within Spring Boot apps:
- I/O rates, duration and errors
- Memory usage broken down by each pool
- Garbage collection and pause times
- Thread count and states
- Open file descriptors etc.
Grafana dashboards can also be set to automatically refresh every few seconds, so if required you can get a close to real-time summary view of you application (depending on your scrape interval).
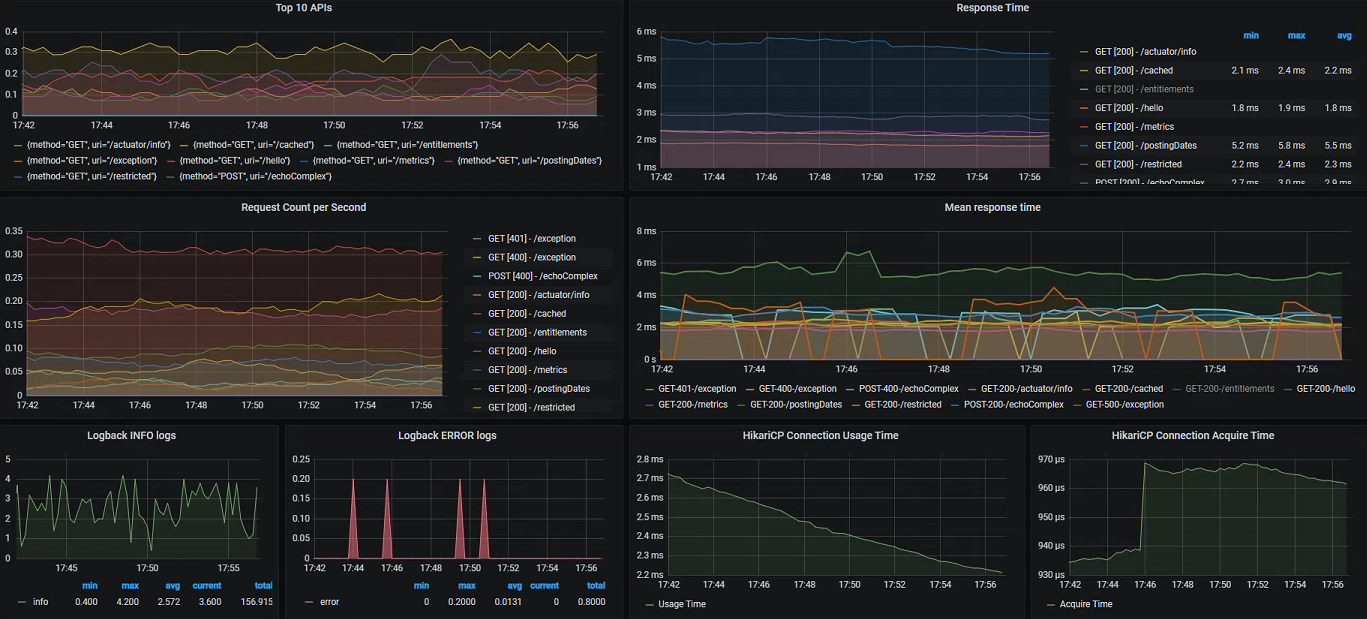
General JVM level measurements can be useful in some cases, but we can get significantly more value by inspecting some of the Spring Boot specific meters which integrate deeply into various aspects of our application:
- HTTP request counts - by URL, method, exception etc
- HTTP response times - latest measured or averaged over a wider time period, can also be split by URL, response codes
- Database connection pool statistics - open connections, create/usage/acquire times
- Tomcat statistics - active sessions, error count
- Logback events - number of info/warn/error lines over time
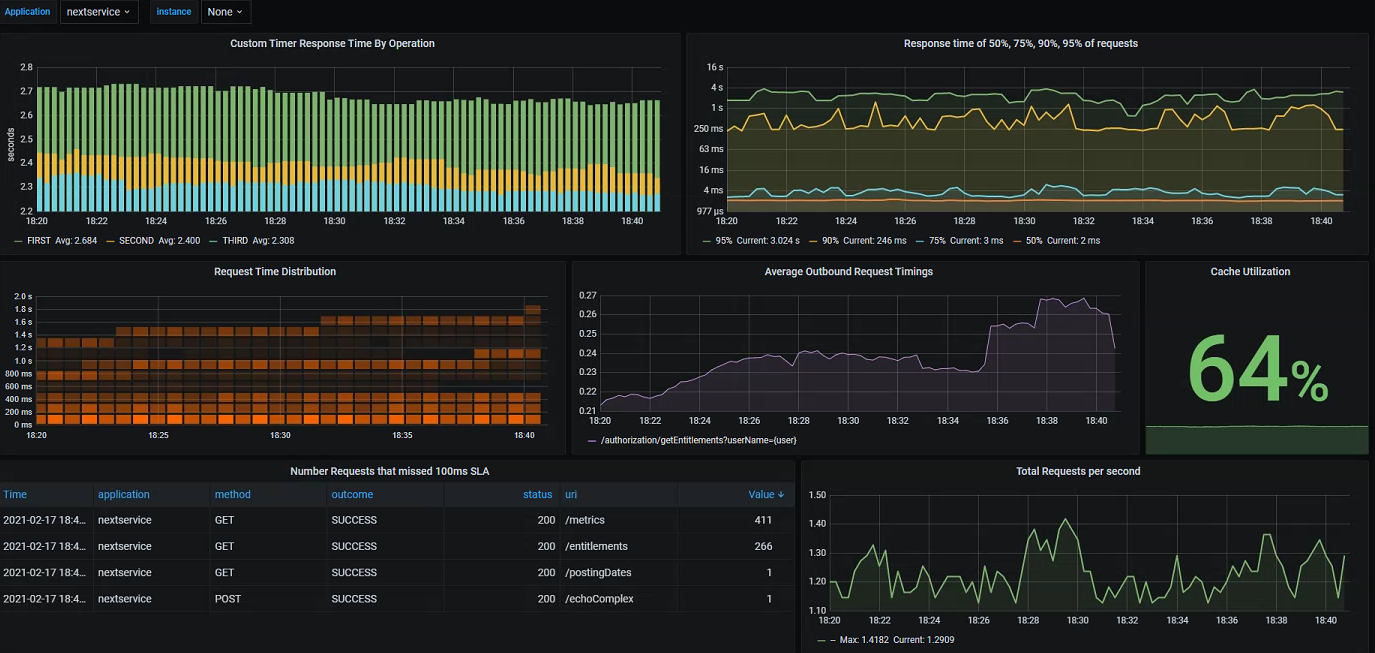
Finally, we can of course also create our own panels and dashboards based on the custom metrics added specifically within our business processes:
- Custom timers with our own tags
- Cache utilization taken from our instrumented Spring Boot cache manager - calculating using the hit/miss counts
- Client request latency/counts - exported from all outbound calls made using
RestTemplate/WebClient - Response time distribution and percentiles - uses a great feature of Prometheus/Grafana allowing as to display aggregated cumulative timing histograms
Since we have easy access to a variety of timing and exception data, we can also record breaches against predefined SLA's - in the example below visualizing all requests which have missed a 100ms threshold value. We could easily do the same for exceptions/errors, or even better utilize our custom metrics integrated into the functional areas:
Bonus: Node Exporter and Elasticsearch
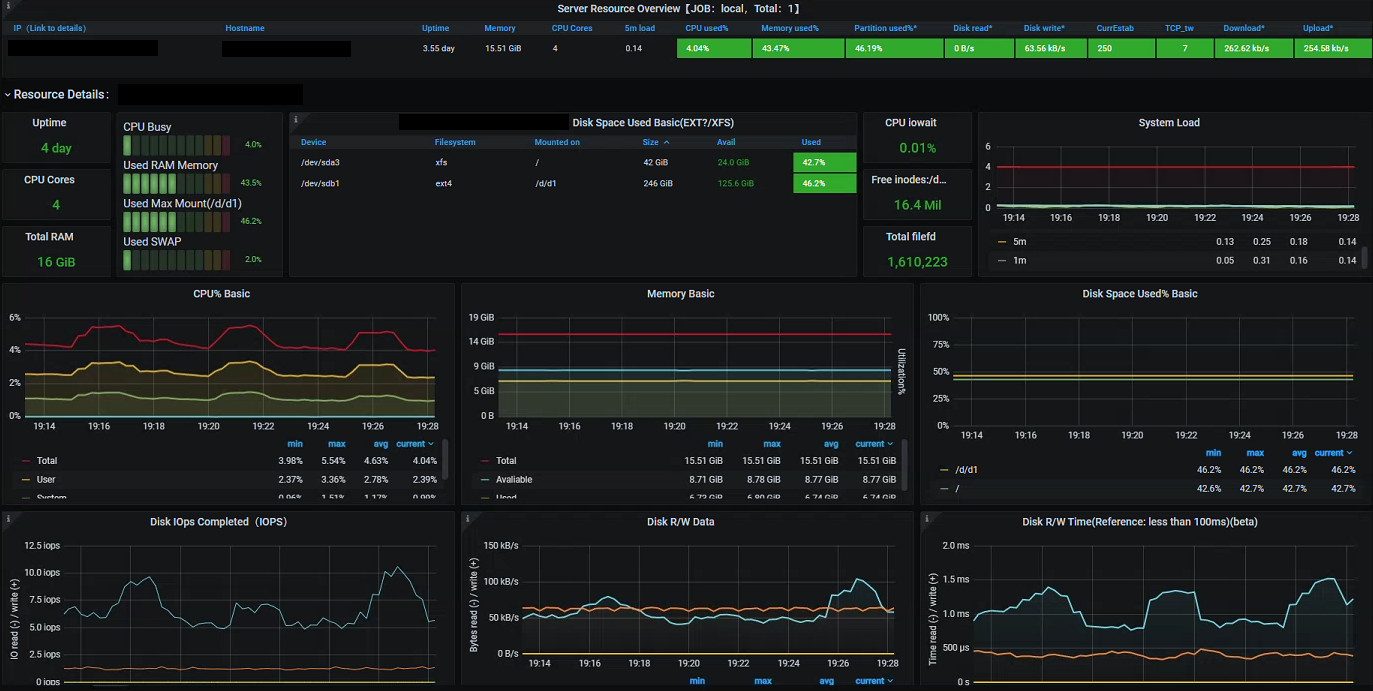
I mentioned above how an additional part of the Promstack is the Node Exporter This is a simple daemon process which exposes a variety of Prometheus metrics about the underlying host it runs on. By default this runs on port 9100, to begin scraping we just need an additional section in the Prometheus config:
- job_name: "node-exporter"
  scrape_interval: 10s
  static_configs:
      - targets: ["localhost:9100"]
Again, there are a variety of community dashboards available which give an idea of some the metrics made available by the exporter:
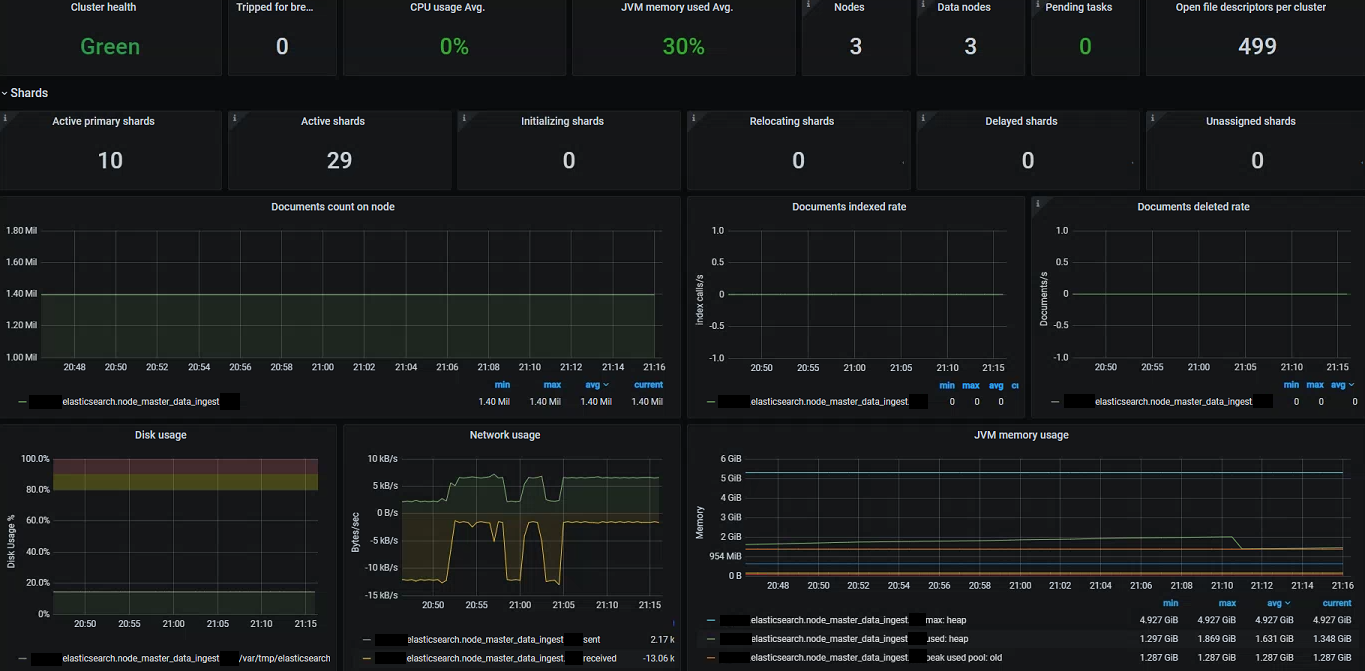
If you are running an Elasticsearch cluster then you can also make use of the community driven exporter to expose a variety of Prometheus metrics. In much the same way we can add this to our Prometheus instance and create a monitoring dashboard:
Takeaways (TL;DR)
PrometheusandGrafanaoffer a very powerful platform for consumption and visualization of Spring Boot metrics- Prometheus runs in a
pull modelmeaning that it needs to maintain a view of the current running instances - this can be done throughstatic targetsor by integrating directly into service discovery. Each app instance must expose anHTTPendpoint serializing a snapshot view of all metrics into thePrometheustextual format - We can easily spin up
PrometheusandGrafanawith the officialDockerimages - Spring Boot applications using
Micrometercan easily integrate with Prometheus by adding the appropriateexporterdependency - no direct code changes required Prometheusprovides it’s own dynamic query languagePromQLwhich is built specifically for dimensional metrics. It allows you to perform aggregation and mathematical operations on time series datasets, alongside the ability to apply filters to metric dimensions for both high level and more focused queries- The
AlertManagercomponent can be used to systematically generate alerts based onPromQLqueries and predefined thresholds Grafanacan sit on top of Prometheus to offer rich visualization and dashboarding capabilities - utilising the underlying time series database andPromQLto generate graphs/charts


