Search Icon

Ryan Harrison My blog, portfolio and technology related ramblings

Prometheus Monitoring Guide Part 4 - Pushgateway and Blackbox Exporter

Pushgateway

The pull approach doesn’t work for ephemeral jobs which don’t run for long enough for Prometheus to scrape them. Pushgateway is a metrics cache for service-level batch jobs. Used to handle the exposition of metrics that have ben pushed from batch/cron jobs. If a Pushgateway instance collecting metrics from many targets goes down, all metrics will be lost.

Prometheus Pushgateway

  • provided as a single Go binary from https://prometheus.io/download/ so can be executed directly
    • ./pushgateway - by default runs on port 9091
    • or with Docker docker run -d -p 9091:9091 prom/pushgateway
  • need to add Pushgateway as scrape target in Prometheus
- job_name: "pushgateway"
  honor_labels: true # instrumentation labels to override target labels
  static_configs:
      - targets: ["localhost:9091"]

Blackbox Exporter

A probing exporter, allowing you to monitor network endpoints - upon probing it returns detailed metrics about the underlying requests.

  • for use when you have no knowledge of system internals, to measure response times, DNS resolution timing, check availability of endpoints etc

Prometheus Blackbox Exporter

  • provided as a single Go binary from https://github.com/prometheus/blackbox_exporter so can be executed directly
    • ./blackbox_exporter - by default runs on port 9115
    • or with Docker docker run --rm -d -p 9115:9115 -v pwd:/config prom/blackbox-exporter:master --config.file=/config/blackbox.yml
  • to retrieve metrics in Prometheus, target the probe endpoint directly (which performs and measures the request)
  • modules used to perform the network request (as defined in the probe URL) are defined in the blackbox.yml config file (HTTP, DNS, SSH)

Perform HTTP Request and Find Content in Response Body

# blackbox.yml
http_find_prom:
    prober: http
    http:
        preferred_ip_protocol: ip4 # by default ipv6
        fail_if_body_not_matches_regexp:
            - "monitoring"

http://localhost:9115/probe?target=prometheus.io&module=http_find_promprobe_success = 1

Perform TCP Probe

http://localhost:9115/probe?target=localhost:8000&module=tcp_connect

Perform DNS Probe

dns_google:
    prober: dns
    dns:
        transport_protocol: "tcp"
        preferred_ip_protocol: ip4
        query_name: "www.google.com"

http://localhost:9115/probe?target=8.8.8.8&module=dns_google

Scraping to Prometheus

# prometheus.yml
scrape_configs:
    - job_name: "blackbox"
      metrics_path: /probe
      params:
          module: [http_2xx] # Look for a HTTP 200 response.
      static_configs:
          - targets:
                - http://prometheus.io # Target to probe with http
      relabel_configs:
          - source_labels: [__address__]
            target_label: __param_target # save current target address into temp param
          - source_labels: [__param_target]
            target_label: instance # move current address to instance label
          - target_label: __address__
            replacement: 127.0.0.1:9115 # redirect address
Read More

Distributed Tracing with Spring Boot & Jaeger

What is Distributed Tracing?

Tracing, alongside metrics and logs, form the three cornerstones of Observability, which aims to increase visibility and let anyone in the team navigate from effect to cause across a complex system. This differs from traditional ‘monitoring’ solutions based on passive consumption from static dashboards etc in that the underlying data should let you gain understanding actively and constantly ask questions about dynamic environments. The team should be able to understand what the system was doing at any particular point in time and identify potential scenarios that could lead to failure before it happens. This is even more important in modern distributed systems, whereby maintaining full visibility into each component and the transitions across component boundaries is vital, but increasingly more complex to manage.

Distributed tracing provides the insight into the flow and lifecycle of a request as it passes through a system. Modern day platforms may be split across many different isolated services, all of which may contribute to produce a final result. In a traditional monolithic style application this would be relatively straightforward to track as all the interactions to other systems would be housed in the same service, same logs etc. In a microservices style architecture a single client request could spawn a number of subsequent requests into various different areas components, which in turn may perform additional downstream requests. In addition, this might not be over the same protocol - HTTP via RESTful endpoints, perhaps various types of queues etc. As the logs for each of these components are separated, it can be extremely difficult and time consuming to track the series of events as it flows through different areas. It is also a very manual process - something that is unlikely to actively yield alerts for a potential point of failure in the future for example. Errors will typically be reported at the top-level, when in reality the issue may have been in a completely different space.

A Familiar Problem?

  • you have a very distributed system, isolated into microservices, communicating over HTTP
  • one request coming from the UI requires data from 2 other services to complete
    • these 2 other services in turn also call out to other components (or out externally)
  • the endpoint starts to fail, first action is to perhaps check the logs
    • an exception is thrown during the HTTP call to the first service
  • now we need to start checking the logs for the second component
    • second component/endpoint is busy - very difficult to correlate which logs lines correspond to the original erroneous request
  • eventually find the correct area, again exception calling another downstream component repeat, repeat

Common distributed tracing solutions attach small pieces of metadata to the headers of each request, that are then propagated downstream to any subsequent services. Each individual component is then configured to send this metadata to a centralised tracing tool (Jaeger or Zipkin) which correlates the data and allows you to visualize the request as it passes through the system. Moving into other areas of the Observability space, these traces are also able to “glue” together the corresponding metrics and logging data - for any particular request/event you would be able to trace through the impact, but also see the logs and metrics from each of the downstream systems without having to manually search.

Jaeger Traces

In summary, tracing aims to provide answers to questions such as:

  • Which systems were involved in servicing a particular request?
    • Which endpoints were called, what data was passed between them?
  • Was there an error? If so where did it originate from?
    • Root-cause-analysis
  • What are the performance bottlenecks?
  • Which endpoints are being called most often and may be best to prioritize for improvements/optimization

Landscape

Before we get into instrumenting our applications and viewing the tracing data, it’s worth understanding a bit of the background into some of the groups involved. This still seems to have many moving pieces and various projects trying to define the language/framework agnostic standards for distributed tracing (converging around OTEL). The aim here in general however is to come up with a generalized solution that avoids vendor locking and allows the traces to cross system boundaries (ensuring the metadata format is the same so any framework/tool can understand and propagate it forward).

OpenTracing

A CNCF project, now an incubating project – was/is a vendor-agnostic standardised API that allowed engineers to instrument traces throughout their code-base. It allowed for the creation of instrumentation libraries that would wrap around application code in order to record and report trace information. Can be thought of like SLF4J, acting as a facade over any implementation of the standard.

OpenCensus

Was a set of libraries that allowed you to collect application metrics and distributed traces in real-time. Similar to OpenTracing, it required the engineer to instrument the API calls into their code with the additional benefit of capturing metric data at the same time. The problem with the two options above is deciding which one to use. Should you use OpenTracing for tracing and OpenCensus for metrics? Or should they use OpenCensus for both tracing and metrics? This is where OpenTelemetry came in.

OpenTelemetry

OpenTelemetry (OTEL) was formed by the merging of OpenTracing and OpenCensus. Currently a CNCF sandbox project aimed to offer a single set of APIs and libraries that standardise how you collect and transfer telemetry data. OTEL not only aims to simplify the choice, but it also allows for cross-platform capability with SDKs being written in several different languages. Its architecture and SDKs allow for companies to develop their own instrumentation libraries and analyse the trace information with supported platforms. https://github.com/open-telemetry/opentelemetry-specification

Terminology

Span

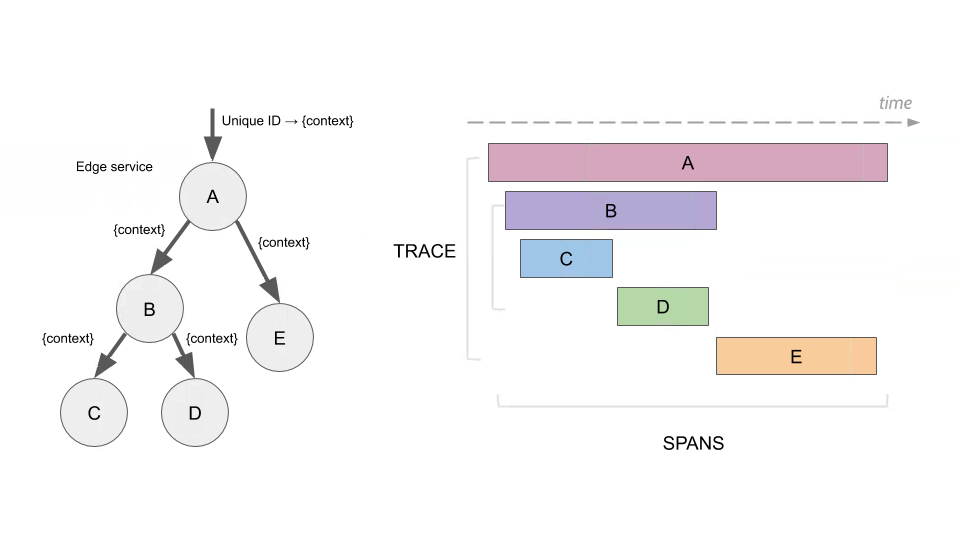
Represents a single unit of work within the system. Spans can be nested within one another to model the decomposition of the work. A detailed explanation can be found on the OpenTracing site. For example, a span could be calling a REST endpoint and another child span could then be that endpoint calling another and so on in a different service.

Trace

A collection of spans which all share the same root span, or more simply put all spans which were created as a direct result of the original request. The hierarchy of spans (each with the own parent span alongside the root span) can be used to form directed acyclic graphs showing the path of the request as it made its way through various components:

Traces and Spans

Trace Context

The bundle of metadata that is passed from one service to the other, allowing for the creation of the final hierarchical trace. Depending on the propagation type used this can take multiple forms, but usually includes at least the root and parent span id’s plus any extra “baggage”.

Context Propagation

The process of transferring trace information from one service to the other. Propagation is done by injecting the trace context into the message that is being sent. In the case of an HTTP call usually it is done by adding specific HTTP headers as defined by the standard. There are multiple different standards for this (which is where the complexity arises). Zipkin uses the B3 format whereas the W3C has also defined a new standard which may be preferable. The libraries being used should be able to support multiple types and convert between them.

Sampling

In larger systems, or for those which process a high number of requests, you may not want to record every trace. It could be unnecessarily expensive to do so or could put pressure on the collectors. Sampling aims to limit the total number of traces recorded whilst still preserving the underlying trends. For example, you might employ a simple rate limiting sampler or use more complex probabilistic or adaptive approaches.

Instrumentation

Injecting code into the service to gather tracing information. Can be done manually or automatically. As manual instrumentation requires some boiler plate code, the preferred way is to use auto instrumentation libraries from the providers.

Jaeger

Developed at Uber and now another CNCF graduated project, Jaeger is a distributed tracing platform that was inspired by Dapper and Zipkin. As the traces are generated by each service across the wider system (or even cross-platform), they can can then be sent to a centralised store such as Jaeger (or Zipkin). Once ingested, Jaeger provides the tools and UI to query and visualize the full traces, generate topology graphs, perform root cause analysis and monitor performance and latencies across components. In contrast to Zipkin, Jaeger has been designed from the ground up to support the OpenTracing standards so is likely to continue to increase in popularity over time.

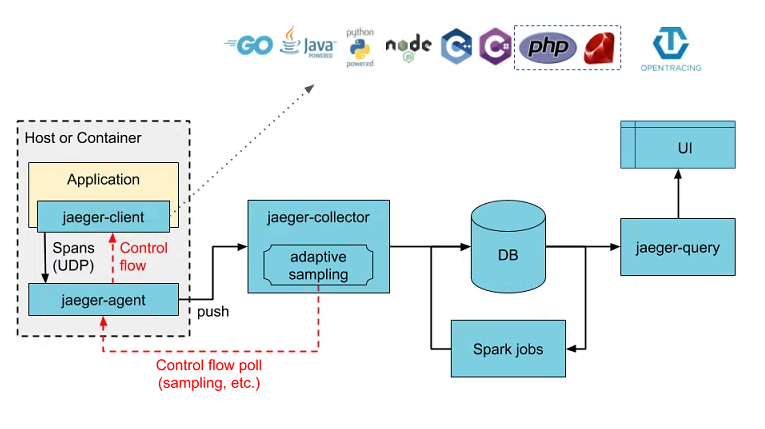
Jaeger Architecture

As shown in the above diagram, Jaeger itself is a large and complicated platform, consisting of a number of different components allowing it to scale to process potentially billions of spans per day. It does however offer an ‘all-in-one’ executable which packages the UI, collector, query and agent into one, but the spans are stored in memory so will be lost after restart. In a typical production deployment something like Elasticsearch would be used as the primary data store.

The easiest way to get started with Jaeger is to utilise the all-in-one offering which is an executable designed for quick local testing, launches the Jaeger UI, collector, query, and agent, with an in memory storage component. You can download the executable directly, or rather you can run through Docker with a single command:

$ docker run -d --name jaeger \
  -e COLLECTOR_ZIPKIN_HOST_PORT=:9411 \
  -p 5775:5775/udp \
  -p 6831:6831/udp \
  -p 6832:6832/udp \
  -p 5778:5778 \
  -p 16686:16686 \
  -p 14268:14268 \
  -p 14250:14250 \
  -p 9411:9411 \
  jaegertracing/all-in-one:1.25

Note how this command sets the Zipkin collector environment variable to inform Jaeger to accept Zipkin traces on port 9411 (will be configured in our app later on). For a full listing of the port mappings visit the Jaeger docs. But for a basic setup you only need 9411 (Zipkin) and 16686 (web). For a full production setup, each component would be deployed separately.

To verify that Jaeger is running successfully, navigate to http://localhost:16686 to view the UI. You should see the landing page:

Jaeger Landing Page

That’s all for now on the Jaeger setup. We can now start instrumenting our Spring applications to begin generating traces and forwarding them to our new Jaeger instance for visualization.

Sample Application

To start testing out the basics and get traces flowing into Jaeger, we’ll create a very simple application consisting of two services communicating over HTTP endpoints:

Jaeger Sample App Design

In a more real-world example this would be significantly more complex, but this basic setup should allow us to see the spans being created and propagated across our services:

  • Client will call the /retrieve endpoint on the first service
    • as this is the originator call a new trace context will be created with a root trace id and a single span
  • Service A performs an HTTP GET request to Service B to retrieve some data
    • another span is created within Service A representing the overall client call
    • the trace context is added to the HTTP headers of the outgoing request (propagation)
  • Service B receives the request
    • a final span id is created encompassing this new unit of work
    • Service B sleeps for a random period of time representing some system latency
  • Both requests complete and the final result is passed back to the Client
    • the trace contexts held internally within Service A/B are sent asynchronously to Jaeger

Spring Cloud Sleuth

Sleuth is a project managed and maintained by the Spring Cloud team aimed at integrating distributed tracing functionality within Spring Boot applications. It is bundled as a typical Spring Starter, so by just adding it as a dependency the auto-configuration handles all the integration and instrumenting across the app. You can just add the Jaeger/Zipkin client libraries and manually instrument yourself, but this requires larges amounts of boilerplate added to all endpoints, listeners to begin/end traces, propagate them etc. Out of the box Sleuth instruments:

  • requests received at Spring MVC controllers (REST endpoints)
  • requests over messaging technologies like Kafka or MQ
  • requests made with RestTemplate, WebClient, etc
    • Sleuth will add an interceptor to ensure that all the tracing information is passed in the requests. Each time a call is made, a new Span is created. It gets closed upon receiving the response.

As you would expect, Sleuth also exposes properties and API’s to configure where the trace data is sent, additional baggage or tags, sampling and logging. The main downside of Sleuth is that it was built around Zipkin traces and so only supports forwarding them to Zipkin (Thrift via Brave) format for now. Luckily Jaeger also supports Zipkin traces, so we can still use Sleuth with Jaeger (but through a different collector). Until recently Sleuth only supported the Zipkin B3 propagation type, but now has support for the W3C format which is preferable moving forward. By adding the brave-opentracing library, Sleuth will also automatically register an OpenTracing Tracer bean allowing us to use the standardised interfaces (much like SLF4J).

Note: Moving forward compatibility with the now GA OpenTelemetry standard (OTEL) is desirable. Sleuth does not currently integrate this as it’s extremely new, but as with most standards, the Spring team are actively working on it (https://github.com/spring-cloud-incubator/spring-cloud-sleuth-otel ). Also, previously one limitation of Sleuth was that it only supported the single tracer implementation (Brave). This has also now been rectified making Sleuth a much more viable solution longer-term (https://github.com/spring-cloud/spring-cloud-sleuth/issues/1497):

“Thanks to doing this abstraction we are able to support new tracer implementations, not only Brave. We’ve decided to add support for the OpenTelemetry SDK as the second one. If in the future if we decide to add new tracers then it will be just a matter of adding a new module that bridges to the Spring Cloud Sleuth one (https://github.com/spring-cloud/spring-cloud-sleuth/commit/6e306e594d20361483fd19739e0f5f8e82354bf5)”

To add Spring Cloud Sleuth to the services, we need the following Gradle config:

ext {
    set('springCloudVersion', "2020.0.3")
}

dependencies {
    implementation 'io.opentracing.brave:brave-opentracing'
    implementation 'org.springframework.cloud:spring-cloud-starter-sleuth'
    implementation 'org.springframework.cloud:spring-cloud-sleuth-zipkin'
}

dependencyManagement {
    imports {
        mavenBom "org.springframework.cloud:spring-cloud-dependencies:${springCloudVersion}"
    }
}

This adds the Spring Cloud BOM to our project and imports both the core Sleuth starter and the sleuth-zipkin starter which allows the app to generate and report Zipkin compatible traces via HTTP (even though we will be sending them to Jaeger in this case).

We also need to set the following in application.properties:

server.port=8001
spring.application.name=service-a
spring.sleuth.propagation.type=B3,W3C
spring.sleuth.opentracing.enabled=true
spring.zipkin.base-url=http://localhost:9411
  • The Spring application name is what will be shown in Jaeger as the service name
  • We enable both B3 and W3C propagation contexts for maximum compatible across platforms
  • OpenTracing is enabled (due to having the brave-opentracing) dependency allowing us to use the io.opentracing.Tracer interfaces etc
  • We set the Zipkin URL- this points to the Zipkin collector on our Jaeger instance as set by the config in the previous section

Next we can create two very simple endpoints in both Service A and B:

@RestController
public class CalculateController {

    private static final Logger log = LoggerFactory.getLogger(CalculateController.class);
    
    @Autowired
    private Tracer tracer;
    
    @GetMapping(value = "/calculate/{key}", produces = MediaType.TEXT_PLAIN_VALUE)
    public String calculate(@RequestHeader Map<String, String> headers, @PathVariable("key") String key) throws InterruptedException {
        log.info("Inside /calculate/{key} with key={}", key);
        log.info("Active Span: " + tracer.activeSpan().context().toSpanId());
        headers.forEach((k, v) -> log.info("Request Header '{}' = {}", k, v));
        long sleep = (long) (Math.random() * 5000L);
        log.info("Sleeping for {}ms", sleep);
        Thread.sleep(sleep);
        log.info("Returning result={}", sleep);
        return Long.toString(sleep);
    }
}

The above shows the endpoint for Service B mimicking a long running calculation:

  • Able to inject the io.opentracing.Tracer instance to access the current trace context
  • Print the Request headers showing us the context propagation headers

A similar endpoint is also added to Service A which just uses a RestTemplate to call Service B. We can now perform a quick test by starting with services locally and visiting http://localhost:8001/retrieve/second. In the logs for Service B we see some interesting lines:

Tracing Logs

  • By default Sleuth adds the trace and span ids to the SLF4J MDC meaning that they can be logged alongside the usual output. This is really useful to perform trace/log correlation, as once you have the root trace id you can use Splunk to directly locate the same request across any downstream services
  • In the headers of the HTTP request from Service A we can see the trace context propagation in action
    • In both B3 and W3C (traceparent) format the trace id and parent span ids are passed with the request
    • Sleuth will capture these id’s and automatically add them to any subsequent requests
  • We can autowire and use the io.opentracing.Tracer instance to print the current active span

Visualizing in Jaeger

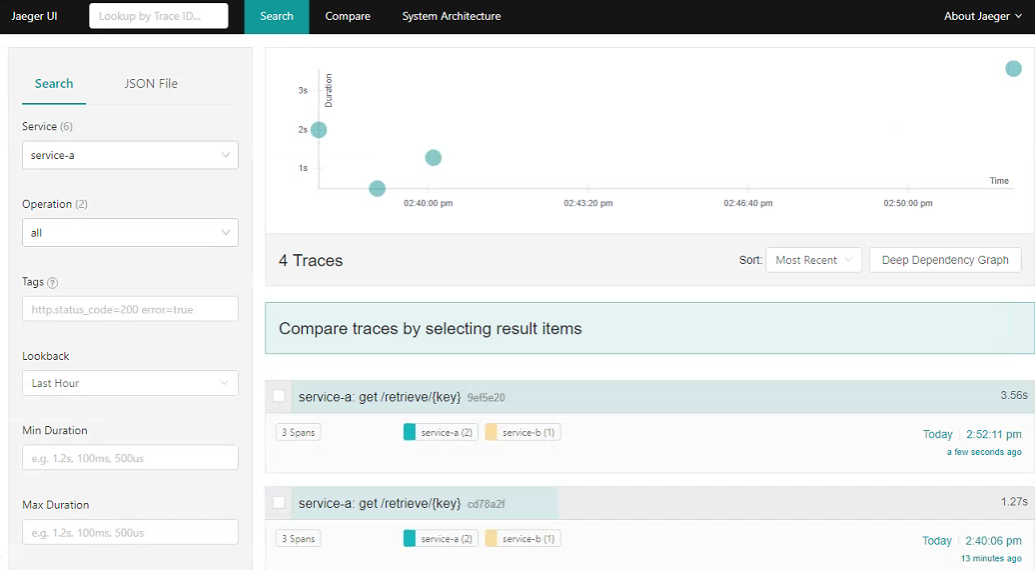
As the Spans are closed at each interval as the request passes from service to service, Sleuth will asynchronously send the trace context to the collector. We can then use a tool such as Jaeger to aggregate and visualize the full trace. Note that Sleuth defaults to a rate limited sampler that means that it will sample up to 1000 transactions per second. Visit the Jaeger dashboard again from above, in the Service dropdown you should see the two new entries for service-a and service-b. Perform a search to see the trace information (click to expand):

Jaeger Search

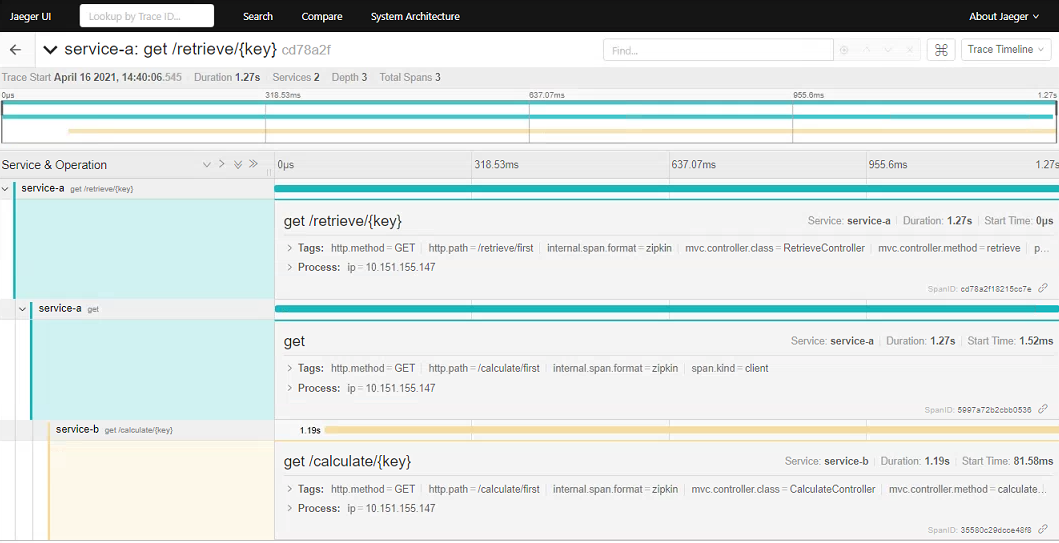
Here we can see all the root traces originated from our call to the /retrieve endpoint. Clicking on an individual item allows you to drill-down into the spans (click to expand):

Jaeger Trace Details

This clearly shows how the initial root GET request to the /retrieve endpoint in Service A spawned a request to the /calculate endpoint in Service B. We can also inspect the timings of each stage - in this case clearly seeing that call to Service B contributes to the bulk of the processing time (which is expected due to the sleep we added).

Each span also displays a number of Tags. By default Sleuth includes some helpful information such as the controller name, method and the full request url. We can use the OpenTracing API to add additional tags to the trace as required. Finally, we can also use Jaeger to construct a graph of the request flow. In our case this is very simple, but this would be extremely useful to generate topologies in larger systems. Below, the Service B span is marked as red since it was a slow running call that took up 94% of the total request times (click to expand).

Trace Request Flow

Further Steps

This just scratches the surface of distributed tracing with Sleuth and Jaeger. Some points of further investigation:

  • Deciding if Spring Sleuth is the best approach. Investigate use of the OpenTracing Jaeger Spring starter instead? Might be more standards compliant but less integrated in the Spring ecosystem?
  • Keep track of progress in OpenTelemetry and the associated integration for Spring apps (ongoing)
  • Test the instrumentation and tracing of Kafka and JMS
  • Understand productionizing Jaeger - security, data storage etc
Read More

Prometheus Monitoring Guide Part 3 - Alerting

Alerting

Alerting rules allow you to define alert conditions based on Prometheus expression language expressions and to send notifications about firing alerts to an external service. Whenever the alert expression results in one or more vector elements at a given point in time, the alert counts as active for these elements’ label sets.

Alerting rules are configured in Prometheus in the same way as recording rules:

# rules/alert_rules.yml
groups:
    - name: example
      rules:
          # Alert for any instance that has a median request latency >1s.
          - alert: APIHighRequestLatency
            expr: api_http_request_latencies_second{quantile="0.5"} > 1
            for: 10m
            labels:
                severity: page
            annotations:
                summary: "High request latency on {{ $labels.instance }}"
                description: "{{ $labels.instance }} has a median request latency above 1s (current value: {{ $value }}s)"
  • for - wait for a certain duration between first encountering a new expression output vector element and counting an alert as firing for this element
  • labels - specifying a set of additional labels to be attached to the alert
  • annotations = informational labels that can be used to store longer additional information such as alert descriptions or runbook links
rule_files:
    - "rules/alert_rules.yml"

Alerts can be monitored through the “Alerts” tab in the Prometheus dashboard (which ones are active, pending, firing etc)

AlertManager

  • another layer is needed to add summarization, notification rate limiting, silencing and alert dependencies on top of the simple alert definitions
  • Prometheus is configured to periodically send information about alert states to an Alertmanager instance, which then takes care of dispatching the right notifications
    • takes care of deduplicating, grouping, and routing them to the correct receiver integration such as email, PagerDuty
  • provided as a single Go binary from https://prometheus.io/download/ so can be executed directly
    • ./alertmanager - by default runs on port 9093
    • or with Docker docker run --name alertmanager -d -p 9093:9093 quay.io/prometheus/alertmanager
    • takes configuration from alertmanager.yml file in same directory
alerting:
    alertmanagers:
        - static_configs:
              - targets:
                    - "localhost:9093"

Sending Email Notifications

  • alertmanager.yml file defines routing tree defining how an alert should be managed. If no labels are matching, default root is used
route:
    receiver: admin

receivers:
    - name: admin
      email_configs:
          - to: "example@gmail.com"
            from: "example@gmail.com"
            smarthost: smtp.gmail.com:587
            auth_username: "example@gmail.com"
            auth_password: "abcdefghijklmnop"

Routing Tree

  • Grouping categorizes alerts of similar nature into a single notification. This is especially useful during larger outages when many systems fail at once and hundreds to thousands of alerts may be firing simultaneously.
    • configure Alertmanager to group alerts by their cluster and alertname so it sends a single compact notification.
  • Inhibition is the concept of suppressing notifications for certain alerts if certain other alerts are already firing
  • Silences are a way to simply mute alerts for a given time. A silence is configured based on matchers, just like the routing tree. Incoming alerts are checked whether they match all the equality or regular expression matchers of an active silence. If they do, no notifications will be sent out for that alert. Configured through the UI. If time based, add condition to the underlying rule instead
  • By default each alert running through the routing tree will halt after matching against the first receiver at the same level - can use continue clause
route:
    receiver: admin # root fallback
    group_wait: 2m # how long to wait for other alerts in a group to fire before notifying (after initial)
    group_interval: 10s # how long to wait before sending a notification about new alerts added to an already firing group
    repeat_interval: 30m # how long to wait before sending a notification again if it has already been sent
    routes:
        - match_re:
              app_type: (linux|windows) # custom label specified in the rule definition file
          receiver: ss-admin # fallback receiver
          group_by: [severity] # group all alerts on a label to send compact notification
          routes:
              - match:
                    app_type: linux # match on more specific label
                receiver: linux-teamlead # target more specific receiver
                routes: # nested routes on different labels
                    - match:
                          severity: critical
                      receiver: delivery-manager
                      continue: true
                    - match:
                          severity: warning
                      receiver: linux-teamlead

        - match_re:
              app_type: (python|go)
          receiver: pec-admin # fallback receiver
          routes:
              - match:
                    app_type: python
                receiver: python-team-admin # fallback receiver
                routes:
                    - match:
                          severity: critical
                      receiver: python-team-manager
                    - match:
                          severity: warning
                      receiver: python-team-lead

inhibit_rules:
    - source_match:
          severity: "critical"
      target_match:
          severity: "warning" # mute warning alert if critical alert already raised in same app and category
      equal: ["app_type", "category"]

receivers:
    - name: linux-team-lead
      email_configs:
          - to: "example@gmail.com"

Checking Tree Syntax

To quickly check whether an alerting route treefile is syntactically correct without starting the AlertManager instance, you can use the amtool utility:

amtool check-config alertmanager.yml

Or https://prometheus.io/webtools/alerting/routing-tree-editor/ can be used to visualize a routing tree

Read More

Aggregating and Visualizing Spring Boot Metrics with Prometheus and Grafana

Note: this is a follow-up post covering the collection and visualization of Spring Boot metrics within distributed environments. Make sure to take a look at Gathering Metrics with Micrometer and Spring Boot Actuator which outlines using Micrometer to instrument your application with some of the built-in Spring Boot integrations and how to start defining and capturing custom metrics.

From the previous part we should now have a Spring Boot application that is capable of capturing a variety of dimensional metrics, but is of limited use since it only stores these values locally within it’s own Micrometer MetricsRegistry. We can use the built-in Spring actuator endpoints to perform simple queries on these metrics, but this alone is not meant as a complete monitoring tool. We don’t have any access to historical data and we need to query the instances directly - not something which is viable when running many (perhaps ephemeral) instances.

Prometheus and Grafana (also sometimes known as Promstack) is a popular and open source stack which aims to solve these problems and provide a complete platform for observing metrics in widely distributed systems. This includes tracking metrics over time, creating complex queries based on their dimensions/tags, aggregating across many instances (or even across the whole platform), raising alerts based on predefined criteria and thresholds, alongside the creation of complex visualizations and dashboards with Grafana.

Basic Architecture

Below is a quick diagram taken from a talk given by one of the Prometheus founders and gives a good summary view of how Prometheus/Grafana work together and integrate with your systems. I would definitely recommend watching for some more background: https://www.youtube.com/watch?v=5O1djJ13gRU
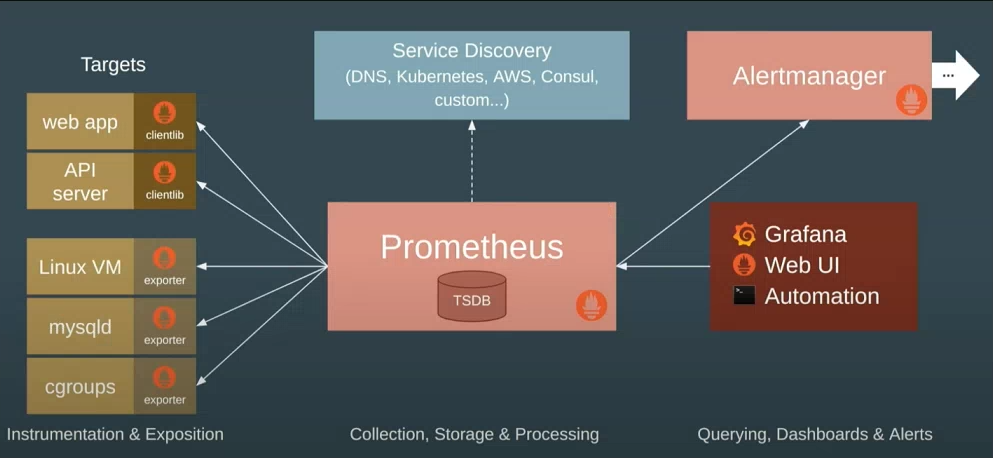
Prometheus Architecture

Prometheus

At the centre is Prometheus which provides the core backbone for collection and querying. It’s based on it’s own internal times series database and is optimized specially for consumption and reporting of metrics. It can be used to monitor your hosts, applications or really anything that can serialize metrics data into the format that it can then pull from.

Crucially, Prometheus supports the dimensional data model that attaches labels/tags to each captured metric. For more details see Part 1 which covers some of the advantages over conventional hierarchical metrics, but in short for example if you were capturing the total number of HTTP requests, you would attach labels to each time series value allowing you to then query and aggregate based on source process, status code, URL etc. The underlying time series database is very well optimized around labelled data sets, so is able to efficiently handle frequent changes in the series’ dimensions over time (e.g for pod names or other ephemeral labels).

Prometheus operates in a pull model, so unlike other solutions whereby your application has to push all of its metrics to a separate collector process itself, Prometheus is instead configured to periodically scrape each of your service instances for the latest meter snapshot. These are then saved into the time series database and become immediately available for querying. Depending on the scrape interval and underlying observability requirements, this can potentially give you close to real-time visibility into your apps.

Rather than having to hardcode host names, Prometheus can integrate directly into your service discovery mechanism of choice (somewhat limited at the moment focusing on cloud offerings, but there are ways around it) in order to maintain an updated view of your platform and which which instances to scrape from. At the application level the only requirement is an endpoint exposing your metrics in the textual serialization format understood by Prometheus. With this approach your app need not know about whatever monitoring tools are pulling metrics - helping to decouple it from your observability stack. You also don’t need to worry about applying collection backpressure and handling errors like may need to in the push model, if for example the monitoring tool starts to become overwhelmed.

Prometheus provides its own dynamic query language called PromQL which understands each major metric type: Counters, Gauges, Summaries and Histograms. This is the main entry point into the underlying time series data and allows you to perform a wide variety of operations on your metrics:

  • binary operations between time series
  • rates over counters - taking into account service restarts
  • filtering the time series by any provided dimension/label
  • aggregating summary stats to create cumulative histograms

These queries can be used to support graphs and dashboards, or also to create alerts in conjunction with the AlertManager component (if for example certain thresholds are breached by an aggregated query across instances).

Grafana

Prometheus is bundled with it’s own simple UI for querying and charting its time series data, but doesn’t come close to the flexibility offered by Grafana which is probably the most well known visualization and dashboarding tool out there. Grafana has deep integrations with Prometheus, allowing you to configure it as a data source like you would any other upstream store (the default is even Prometheus now) and then write your own PromQL queries to generate great looking charts, graphs and dashboards.

Following on with the config-as-code approach, all of your Grafana dashboards can also be exported as JSON files which makes sharing considerably easier. For JVM/Spring based applications there are many community dashboards already available that you can begin utilizing immediately (or otherwise as a decent starting point for your own visualizations).

Micrometer / Prometheus Exporter

Since Prometheus operates in a pull model, we need our Spring Boot application to expose an HTTP endpoint serializing each of our service metrics. As discussed in the previous part, this is where Micrometer comes into it’s own. Since it acts as a metrics facade, we can simply plug in any number of exporters that provide all the necessary integrations - with zero changes needed to our actual application code. Micrometer will take care of serializing it’s local store (and maybe pushing) into whatever formats required - be it Prometheus, Azure Monitor, Datadog, Graphite, Wavefront etc.

For our basic Spring Boot application, the actuator endpoint does something similar to this, but it doesn’t offer the correct format for Prometheus to understand. Instead, we can add the below library provided by Micrometer to enable the required exporter functionality:

implementation("io.micrometer:micrometer-registry-prometheus")

In other apps you would need to manually setup an endpoint integrating with your local MetricsRegistry, but in this case Spring Boot sees this library on the classpath and will automatically setup a new actuator endpoint for Prometheus. These are all disabled by default so we also need to expose it through a management property:

management.endpoints.web.exposure.include=metrics,prometheus

If you start the application, now you should be able to visit http://localhost:8080/actuator/prometheus to see the serialized snapshot:

Prometheus Exporter Snapshot

You should see each of the built-in metrics provided by Spring Boot (JVM memory usage, HTTP requests, connection pools, caches etc) alongside all of your custom metrics and tags. Taking one of these lines to examine further gives some insight into how Prometheus stores these metrics:

http_server_requests_seconds_count{application="nextservice",exception="None",method="GET",outcome="SUCCESS",status="200",uri="/actuator/info",} 1.0

In this case it’s the total number of HTTP requests serviced by our app - for now just one after I called one of the actuator endpoints. The serialized form of the counter consists of the metric name, a series of tags (representing the dimensions) and a 64-bit floating point value - all of which will be stored in the time series dataset after capture. Since Prometheus understands the dimensional nature of our metrics, we can use PromQL to perform filtering, aggregations and other calculations specific to these attributes and not the metric as a whole. The serialized form also includes metadata on the underlying meters, including a description which will be available later on as tooltips.

Setting Up Prometheus & Grafana

Prometheus is bundled as a single Go binary, so is very easy to deploy even as a standalone process, but for the purposes of this quick demo we will instead make use of the official Docker image. Refer to this post for more details about setting up and running Prometheus.

docker run -p 9090:9090 -v /path/to/prometheus.yml:/etc/prometheus/prometheus.yml prom/prometheus

The above command will run a Prometheus instance exposed on port 9090, binding the configuration YAML file from our own working directory (change as needed).

prometheus.yml

scrape_configs:
    # The job name is added as a label `job=<job_name>` to any timeseries scraped from this config.
    - job_name: "springboot"
      metrics_path: "/next/actuator/prometheus"
      scrape_interval: 5s
      static_configs:
          - targets: ["localhost:8080"] # wherever our Spring Boot app is running

The Prometheus configuration file has many options, more information at https://prometheus.io/docs/prometheus/latest/configuration/configuration/. For now though we just setup a single scrape target which tells Prometheus where to pull our metrics from - in this case a single static host, but could also be your service discovery mechanism. We also point the path to our new actuator URL and set the scrape interval.

For Grafana we can do something very similar with Docker. Refer to this article for more details about installation. Here we run a basic Grafana instance exposed on port 3000:

docker run -p 3000:3000 grafana/grafana

Using Prometheus

Visit localhost:9090 in the browser to view the Prometheus dashboard. On the Status->Targets page you should see the single static host - indicating that Prometheus is able to connect successfully and is continuously pulling metrics from our Spring Boot app:

Prometheus Targets

The built-in dashboard also lets you test and run PromQL expressions, the results of which can be in tabular form or as a simple graph. To test this out we can use the HTTP request counter from before to produce a close to real-time view into the traffic being handled by our app (the below returns the per second average over the last 5 minutes):

rate(http_server_requests_count[5m])
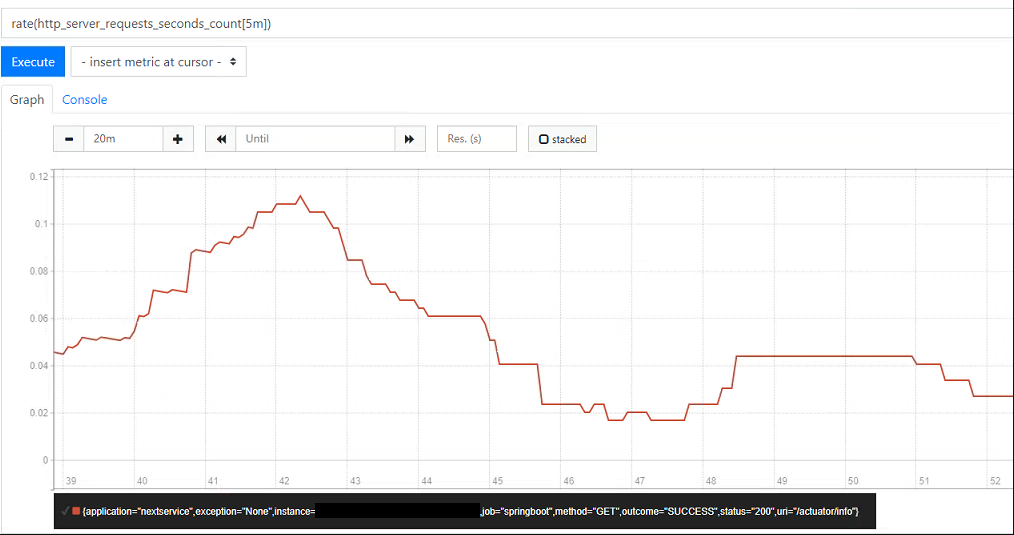
Prometheus Rate Graph

If we plot this using the graph tab and generate some load on the application, you should see the rate start to increase over time. At the bottom you should also be able to see each of the tags attached to the time series - in this case the app name, instance, URI, status code, method etc - any of these can be used to further refine the PromQL query as needed. If for example we were only interested in the count of successful requests we could instead run:

rate(http_server_requests_count{outcome="SUCCESS"}[5m])

Note that the Prometheus charts don’t update themselves automatically even though the underlying data has been updated, so you need to search again periodically (Grafana does however do this). Although basic, the built-in editor is useful to explore the underlying dataset and build queries before creating dashboards. Another popular example is mapping memory usage - below we can clearly see garbage collection happening, with memory usage broken down by area and pool type (any of which could be filtered on within the PromQL query):
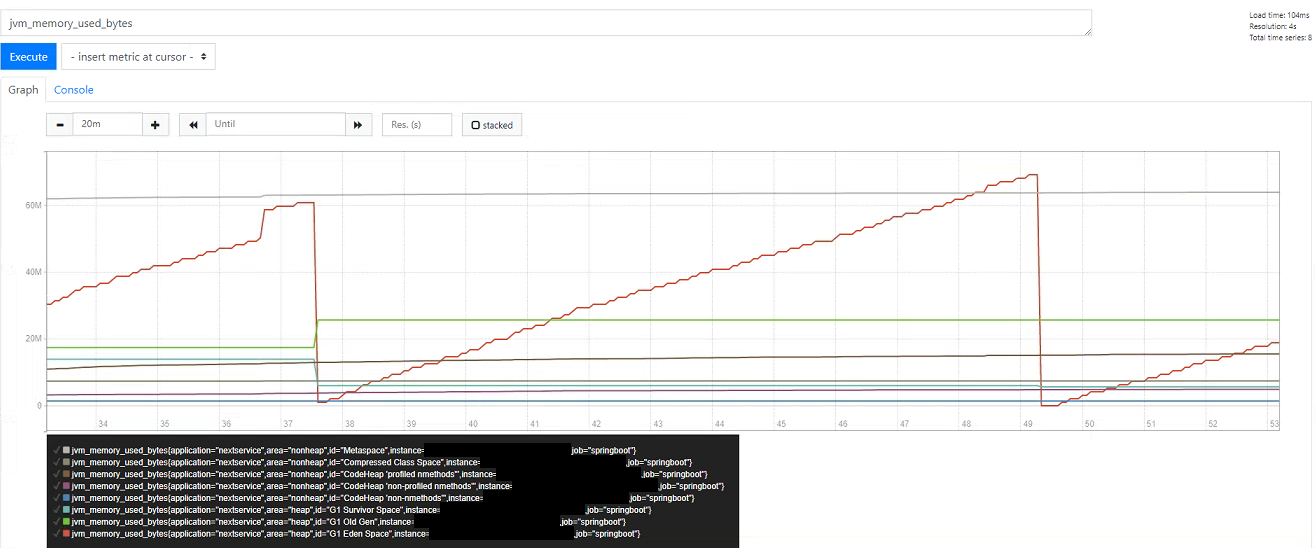
Prometheus JVM Usage Graph

See this post on PromQL for a more in depth look at what it’s capable of: PromQL and Recording Rules

Using Grafana

The Prometheus graphs are useful for adhoc queries, but Grafana is significantly more powerful in terms of its capabilities for visualization and creation of summary dashboards. Visit localhost:3000 to access the instance we started alongside Prometheus. We first need to create a new datasource pointing to our Prometheus instance on the same host.

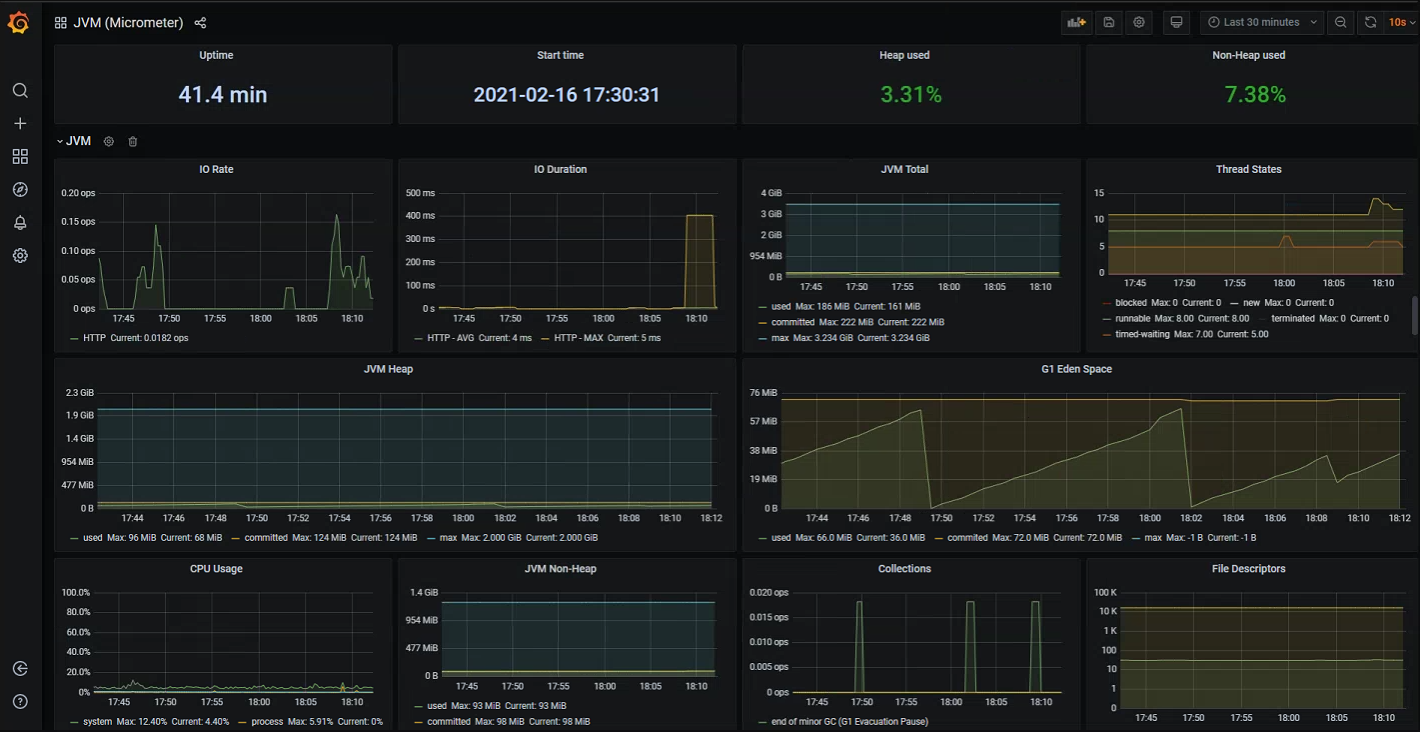
We could begin creating our own custom dashboards immediately, but one of the great things about Grafana is that there are many open source community dashboards that we can reuse in order to get going quickly. For example the below screenshot shows a general JVM application dashboard which displays many key indicators out-of-the-box. All of these are default JVM metrics that get measured and exported automatically by default within Spring Boot apps:

  • I/O rates, duration and errors
  • Memory usage broken down by each pool
  • Garbage collection and pause times
  • Thread count and states
  • Open file descriptors etc.

Grafana JVM Dashboard

Grafana dashboards can also be set to automatically refresh every few seconds, so if required you can get a close to real-time summary view of you application (depending on your scrape interval).

General JVM level measurements can be useful in some cases, but we can get significantly more value by inspecting some of the Spring Boot specific meters which integrate deeply into various aspects of our application:

  • HTTP request counts - by URL, method, exception etc
  • HTTP response times - latest measured or averaged over a wider time period, can also be split by URL, response codes
  • Database connection pool statistics - open connections, create/usage/acquire times
  • Tomcat statistics - active sessions, error count
  • Logback events - number of info/warn/error lines over time
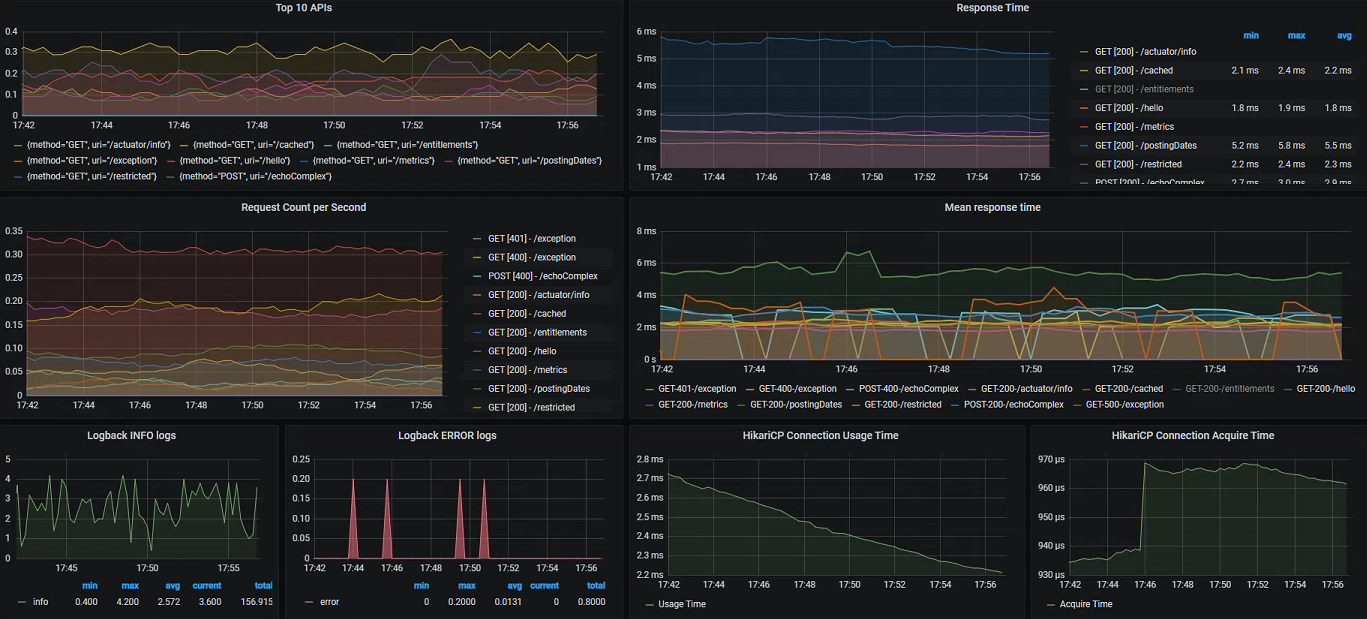
Grafana Spring Dashboard

Finally, we can of course also create our own panels and dashboards based on the custom metrics added specifically within our business processes:

  • Custom timers with our own tags
  • Cache utilization taken from our instrumented Spring Boot cache manager - calculating using the hit/miss counts
  • Client request latency/counts - exported from all outbound calls made using RestTemplate/WebClient
  • Response time distribution and percentiles - uses a great feature of Prometheus/Grafana allowing as to display aggregated cumulative timing histograms

Since we have easy access to a variety of timing and exception data, we can also record breaches against predefined SLA's - in the example below visualizing all requests which have missed a 100ms threshold value. We could easily do the same for exceptions/errors, or even better utilize our custom metrics integrated into the functional areas:
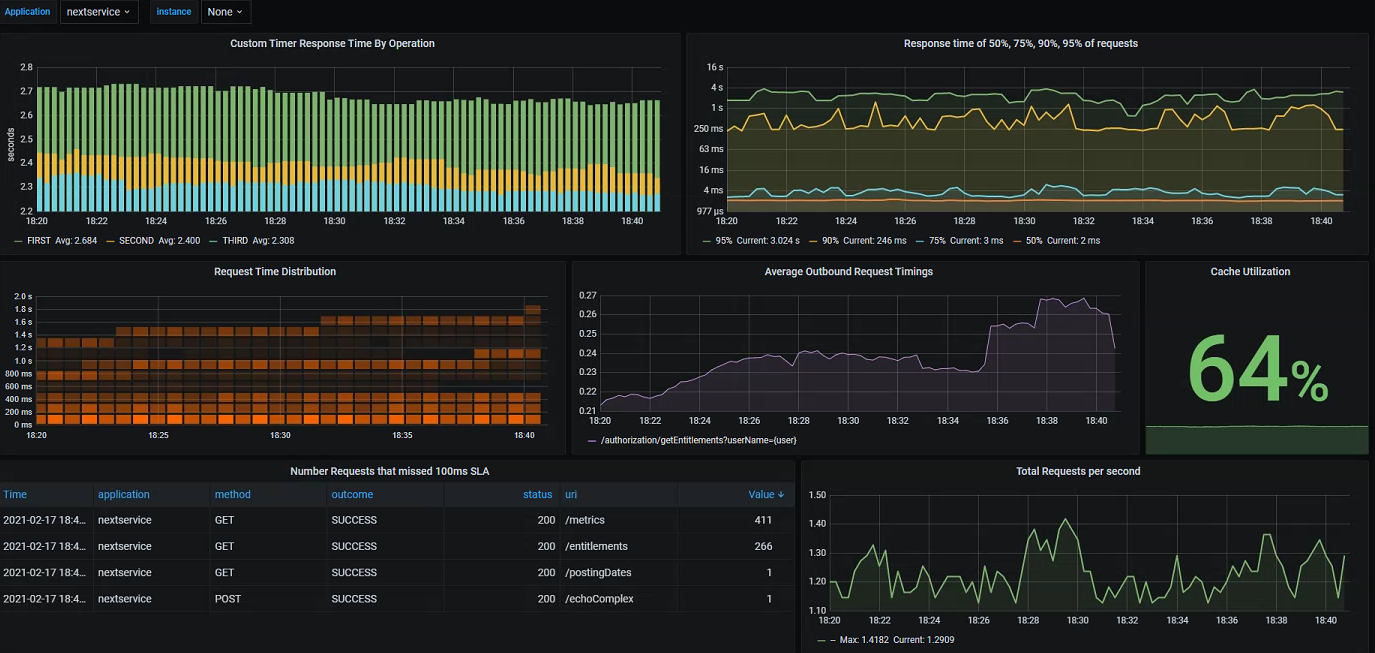
Grafana Custom Dashboard

Bonus: Node Exporter and Elasticsearch

I mentioned above how an additional part of the Promstack is the Node Exporter This is a simple daemon process which exposes a variety of Prometheus metrics about the underlying host it runs on. By default this runs on port 9100, to begin scraping we just need an additional section in the Prometheus config:

- job_name: "node-exporter"
  scrape_interval: 10s
  static_configs:
      - targets: ["localhost:9100"]

Again, there are a variety of community dashboards available which give an idea of some the metrics made available by the exporter:
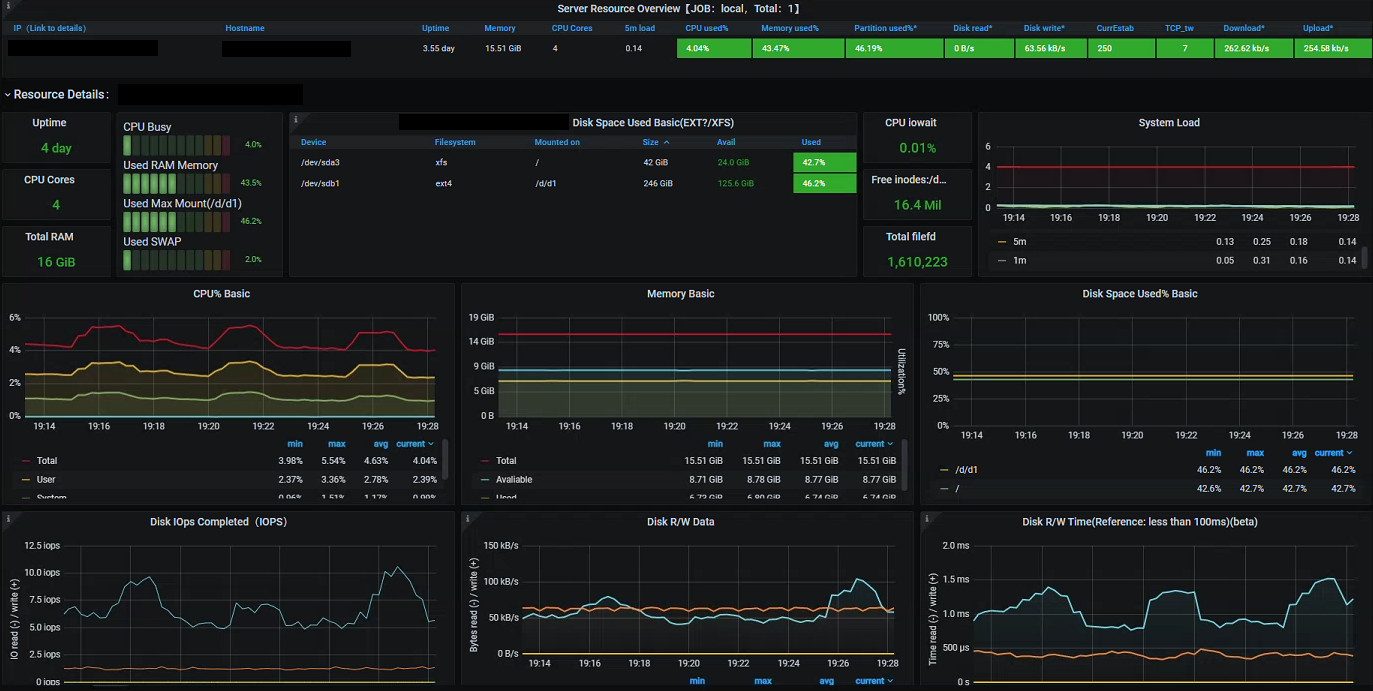
Grafana Node Exporter Dashboard

If you are running an Elasticsearch cluster then you can also make use of the community driven exporter to expose a variety of Prometheus metrics. In much the same way we can add this to our Prometheus instance and create a monitoring dashboard:
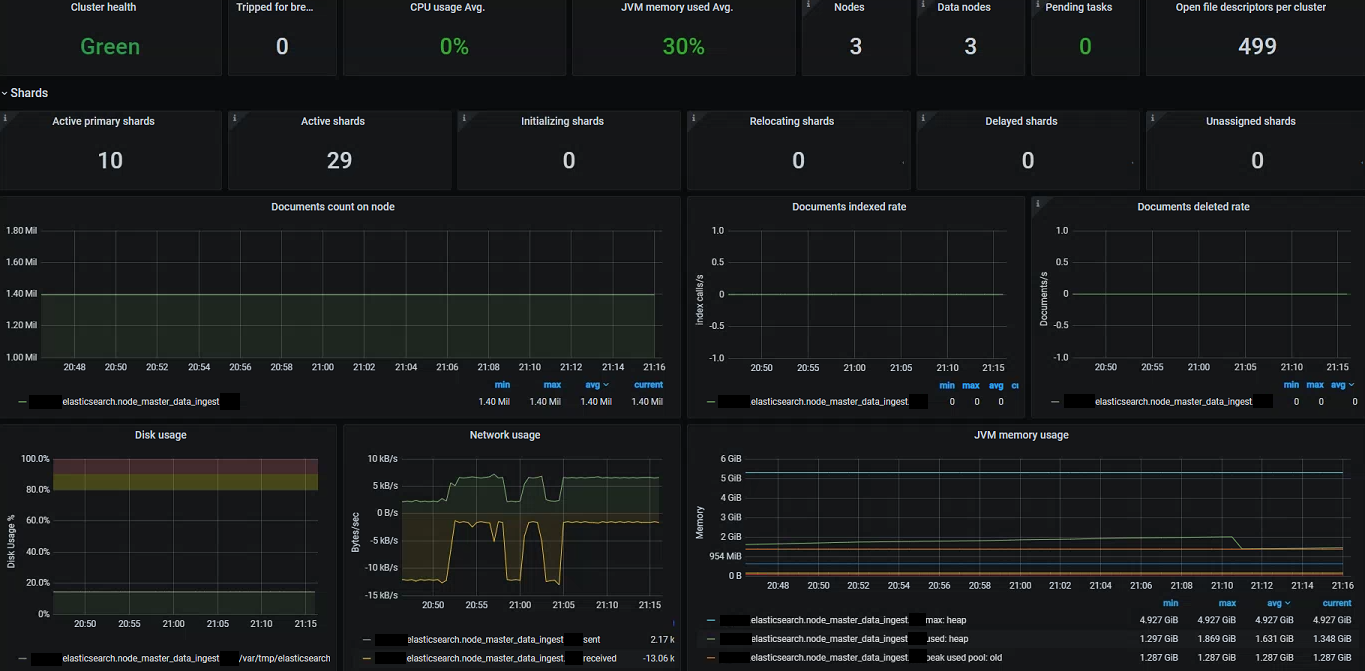
Grafana Elasticsearch Dashboard

Takeaways (TL;DR)

  • Prometheus and Grafana offer a very powerful platform for consumption and visualization of Spring Boot metrics
  • Prometheus runs in a pull model meaning that it needs to maintain a view of the current running instances - this can be done through static targets or by integrating directly into service discovery. Each app instance must expose an HTTP endpoint serializing a snapshot view of all metrics into the Prometheus textual format
  • We can easily spin up Prometheus and Grafana with the official Docker images
  • Spring Boot applications using Micrometer can easily integrate with Prometheus by adding the appropriate exporter dependency - no direct code changes required
  • Prometheus provides it’s own dynamic query language PromQL which is built specifically for dimensional metrics. It allows you to perform aggregation and mathematical operations on time series datasets, alongside the ability to apply filters to metric dimensions for both high level and more focused queries
  • The AlertManager component can be used to systematically generate alerts based on PromQL queries and predefined thresholds
  • Grafana can sit on top of Prometheus to offer rich visualization and dashboarding capabilities - utilising the underlying time series database and PromQL to generate graphs/charts
Read More

WSL2 - Better Managing System Resources

WSL2 is great, but unfortunately after moderate usage it’s easy to get in a situation where it will eat up all of your disk space and use up to 50% of your total system memory. We’ll go over how to address these issues below.

Setting a WSL2 Memory Limit

By default the WSL2 will consume up to 50% of your total system memory (or 8GB whichever is lower). You can configure an upper limit for the WSL2 VM by creating a .wslconfig file in your home directory (C:\Users\<user>\.wslconfig).

[wsl2]
memory=6GB
swap=0

Note that in this case the Linux VM will consume the entire amount regardless of actual usage by your apps, but it will at least prevent it growing beyond this limit.

Free Unused Memory

As described in this post the Linux kernel often uses available memory for it’s page cache unless its otherwise needed by a program running on the system. This is good for performance, but for WSL2 it can often mean the VM uses a lot more memory than it really needs (especially for file-intensive operations).

Whilst the WSL2 VM is running can you also run a simple command to drop the memory caches and free up some memory:

sudo sh -c \"echo 3 >'/proc/sys/vm/drop_caches' && swapoff -a && swapon -a && printf '\n%s\n' 'Ram-cache and Swap Cleared'\"

Compact the WSL2 Virtual Disk

If you copy some large files into WSL2 and then delete them, they will disappear from the filesystem but the underlying virtual disk may have still grown in size and the extra space will not be re-used. We can run a command to optimize/vacuum the virtual disk file to reclaim some space.

## Must be run in PowerShell as Administrator user
# Distro Examples:
#   CanonicalGroupLimited.UbuntuonWindows_79rhkp1fndgsc
#   CanonicalGroupLimited.Ubuntu20.04onWindows_79rhkp1fndgsc

cd C:\Users\user\AppData\Local\Packages<Replace-Eg-CanonicalGroupLimited\LocalState
wsl --shutdown
optimize-vhd -Path .\ext4.vhdx -Mode full

https://github.com/microsoft/WSL/issues/4699

Docker

If you run a lot of Docker containers within WSL2m a lot of disk space may be used unnesessarily by old images. We can run the standard Docker command to remove any old/dangling images, networks and volumes:

docker system prune

Along the same lines as above as we can also compact the VM file that Docker Desktop creates to get some disk space back. You’ll want to open PowerShell as an admin and then run these commands:

# Close all WSL terminals and run this to fully shut down WSL.
wsl.exe --shutdown

# Replace <user> with your Windows user name. This is where Docker stores its VM file.
cd C:\Users\user\AppData\Local\Docker\wsl\data

# Compact the Docker Desktop WSL VM file
optimize-vhd -Path .\ext4.vhdx -Mode full

The above optimize-vhd command will only work on Windows 10 Pro. For folks on the Home edition there are some scripts with workarounds:

Read More